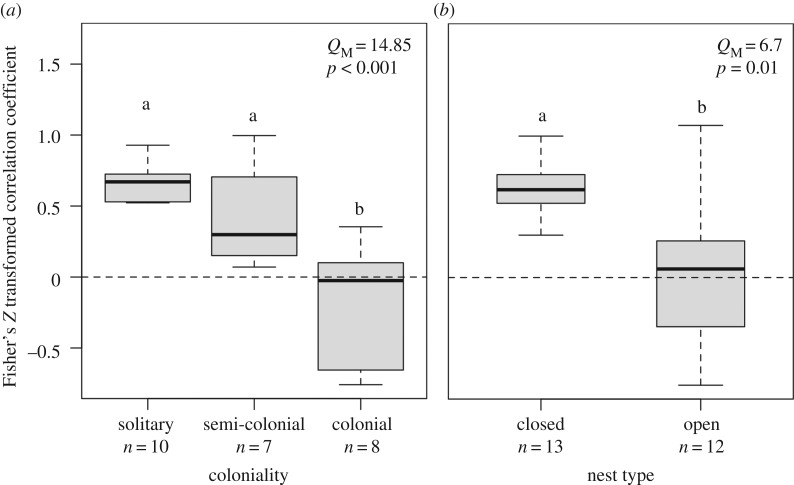
Figure 3.
Distribution of effect sizes according to (a) coloniality and (b) nest type. Boxplots show the median and first and third quartile of the effect sizes, and whiskers indicate the range of non-outlier values. The dashed horizontal line represents no yolk testosterone response to competitive environment. Letters indicate significant differences between groups after adjusting for the potentially inflated false-discovery rate using the Benjamini and Hochberg correction. Results of the omnibus tests match those from the full dataset and analyses in table 1. Sample size (n) indicates the number of records per category.

