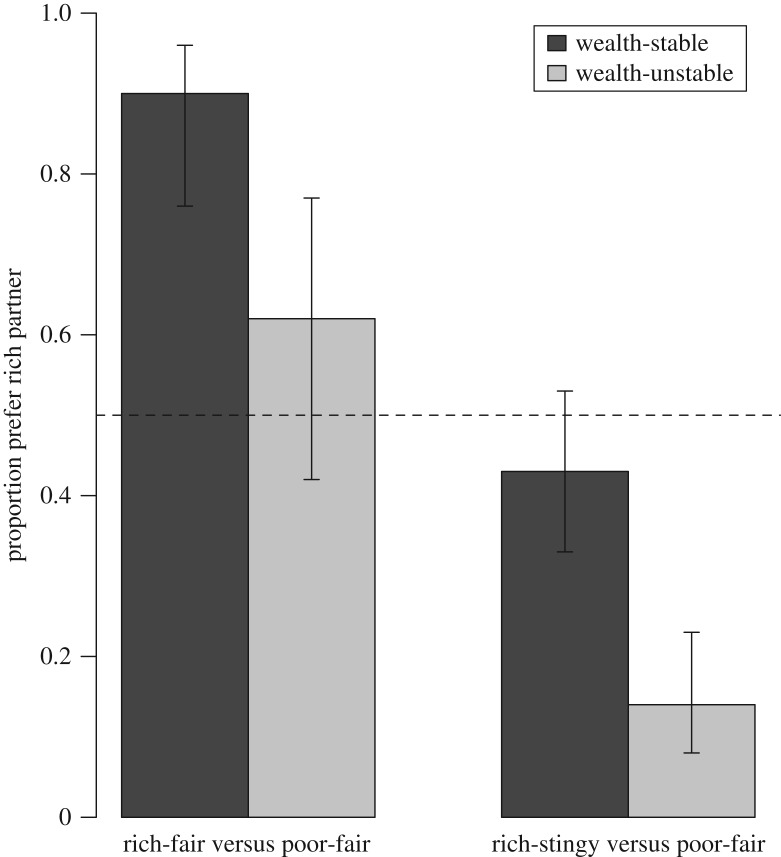
Figure 1.
Choosers' preferences for the rich partner when choosing between rich-fair and poor-fair, and between rich-stingy and poor-fair, respectively. Dark grey bars are when wealth was stable; light grey bars are when wealth was unstable. Figure shows proportion choosers picking the rich partner (denominator is the total number of choosers who expressed a preference) with 95% binomial confidence intervals. The dotted horizontal line at 0.5 is what would be expected if choosers were selecting partners at random.

