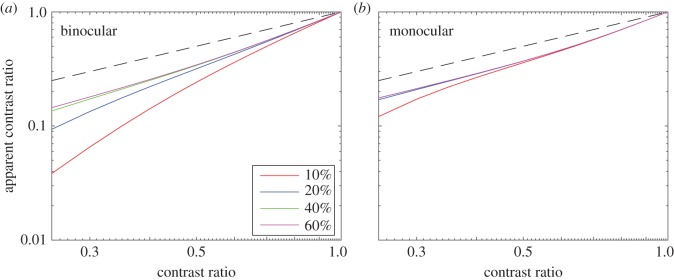
Figure 5.
Apparent contrast ratio as a function of the stimulus contrast ratio when the base contrast was fixed at 10% (red), 20% (blue), 40% (green) and 60% (magenta). Dashed black line shows the prediction of linear summation, for which the apparent contrast ratio is identical to the contrast ratio.

