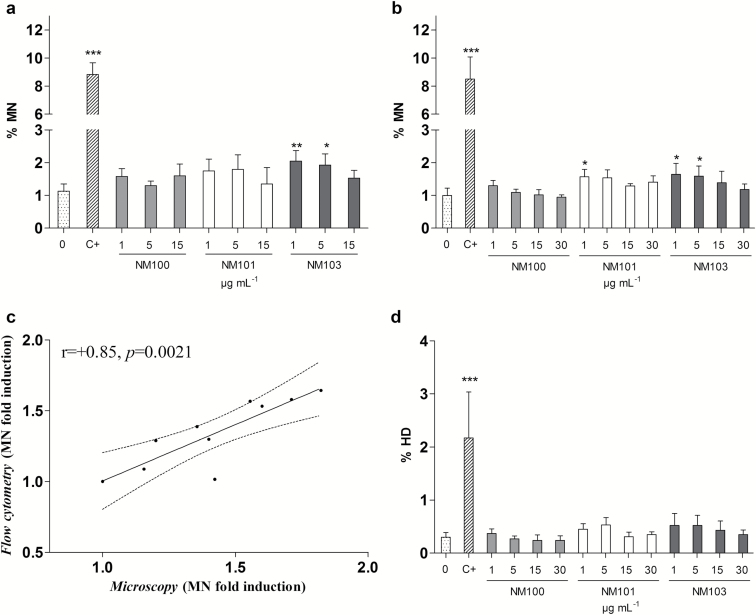
Figure 7.
Micronuclei induction analysed by microscopy (a) and by flow cytometry (b) following 48-h BEAS-2B exposure to particles. (c) Pearson correlation between MN induction assessed by flow cytometry and microscopy. (d) Percentage of hypodiploid nuclei (HD). *P < 0.05, **P < 0.01, ***P < 0.001. C+, 0.05 µg/ml mitomycin-C.

