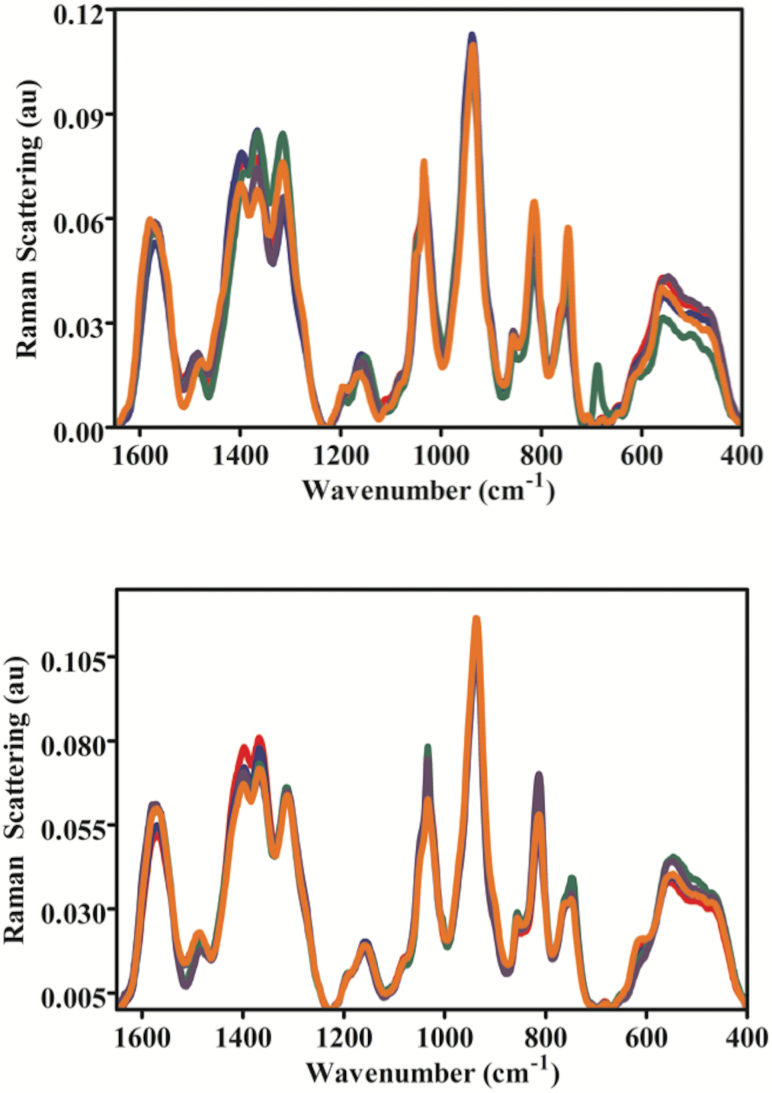
Figure 6.
SERS spectra of lipid extracts of brain tissue from male (upper panel) and female (lower panel) zebrafish post-exposure with one of four CBNs. Fish (2 males and 2 females) exposures were conducted in 10 L glass tanks. CNP exposure (0.1 mg L−1) was initiated and run for 21 days. Post-exposure and isolation of brain tissue, lipids were extracted; these were then mixed with Ag NPs prior to SERS. The spectral data were then inputted into MATLAB and preprocessed following wavelet de-noising, cut to 400–1800 cm−1, second differentiation and vector normalisation. —, Control;—, C60 fullerene-treated; —, Long MWCNT-treated; —, Short MWCNT-treated; and, —, SWCNT-treated.

