
Figure 5.
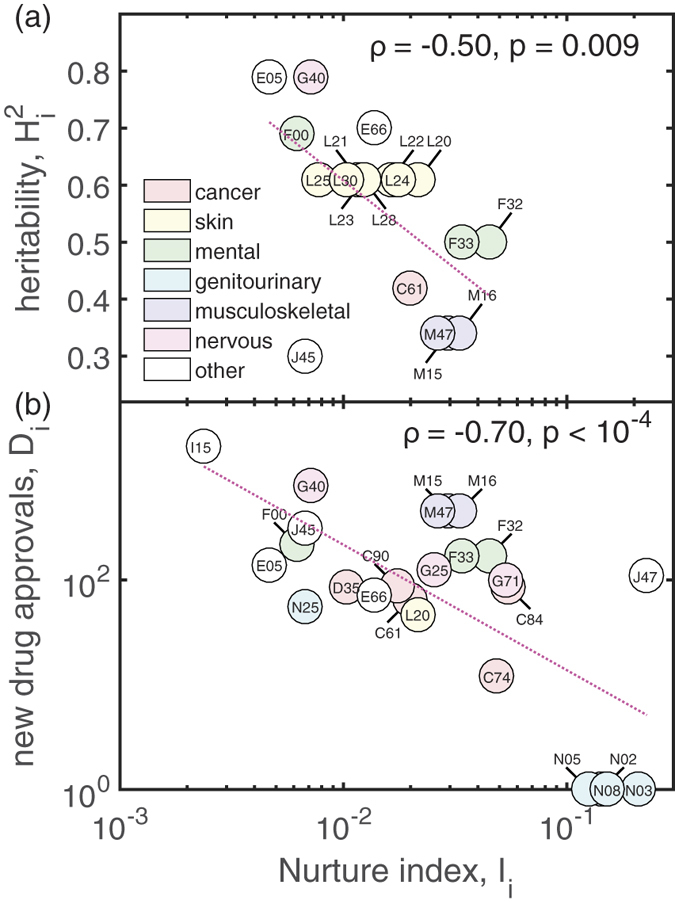
Heritability  , (a) and the number of newly developed drugs Di (b) are negatively correlated with the relevance of environmental risk factors for diseases. Each circle corresponds to one disease phenotype, labeled by its three-digit ICD10 code. Both,
  and Di are shown as a function of the nurture index. Colors indicate the main ICD chapter to which the diseases belong. We observe particularly high Ii values for diseases of the genitourinary system, various cancers, depression, and bronchiectasis.