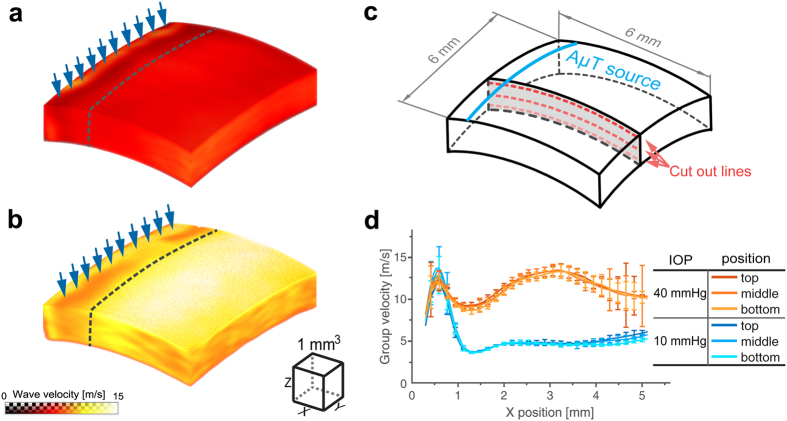
Figure 3. Mechanical wave group velocity in ex-vivo porcine eye cornea.
3D maps at two different intraocular pressures (a) −10 mmHg, and (b) −40 mmHg for propagation at 0°. The group velocity is calculated at each point within the 6 mm × 6 mm lateral field of view using temporal profiles of recorded signals and the phase zero-crossing method applied to the cross-correlation function between neighboring signals with no averaging applied to recorded signals. To create the velocity maps, a moving average procedure is applied to the computed velocity distributions within an effective volume of 294 μm × 294 μm × 114 μm in X, Y and Z directions, respectively. The excitation line is indicated by blue arrows. The dashed line approximately indicates the near field region of wave propagation. Three lines are chosen for different depths of wave propagation in the cornea (close to the top surface, in the middle and close to the bottom of the cornea) as depicted in (c). Group velocity on these lines is plotted in (d) for both intraocular pressures. High fluctuations of group velocity at distances far from the AμT source are related with reduced signal-to-noise ratio in that region.

