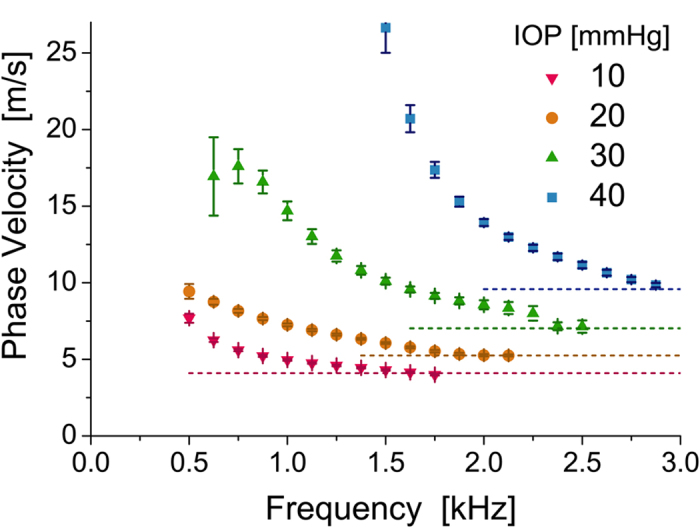
Figure 6. Phase velocity dispersion in ex-vivo porcine eye cornea.

Temporal profiles of propagating mechanical waves and their subsequent Fourier transform can be used to calculate the velocity of different frequency components, i.e. phase velocity. The phase velocity shows a strong frequency dispersion in the low-frequency range due to the top and bottom boundaries of the cornea, and approaches a high-frequency limit (dashed lines) that differs at different intraocular pressures for propagation at 0°. The high-frequency threshold of phase velocity can be used to evaluate cornea elasticity.
