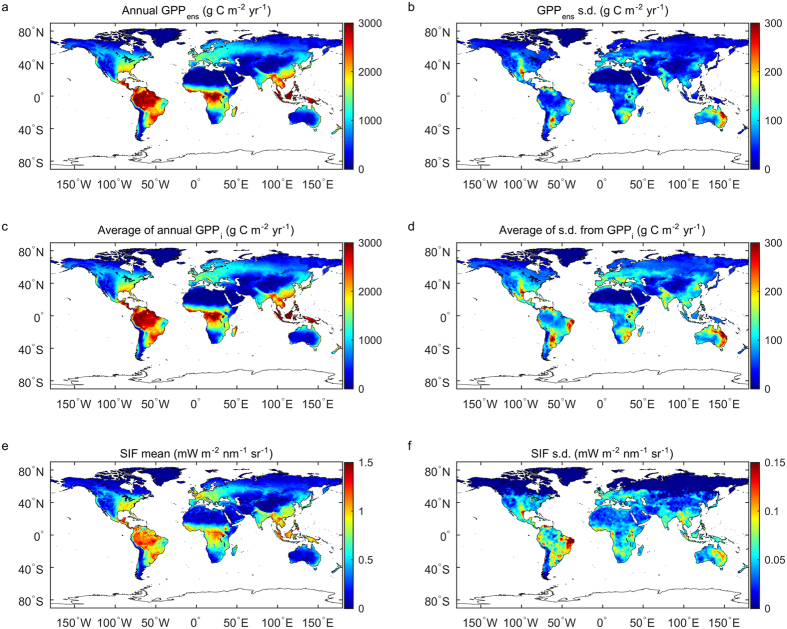
Figure 1. Mean and variability of GPP and SIF (2000–2011).
(a,b) Mean and standard deviation (s.d., as a representative of variability) of annual GPP from ensemble of all models with the 2nd order weight (GPPens) for 2000–2011. (c,d) unweighted average of annual GPP and GPP s.d. calculated from each individual model (GPPi) for 2000–2011. (e,f) Annual mean SIF and SIF s.d. from GOME-2 for 2007 to 2015. The SIF variances were smoothed with a 3 × 3 pixel smoothing window after removing the error (see Supporting Information, Text S7). Maps were created using Matlab R2016a (http://www.mathworks.com/products/matlab/)

