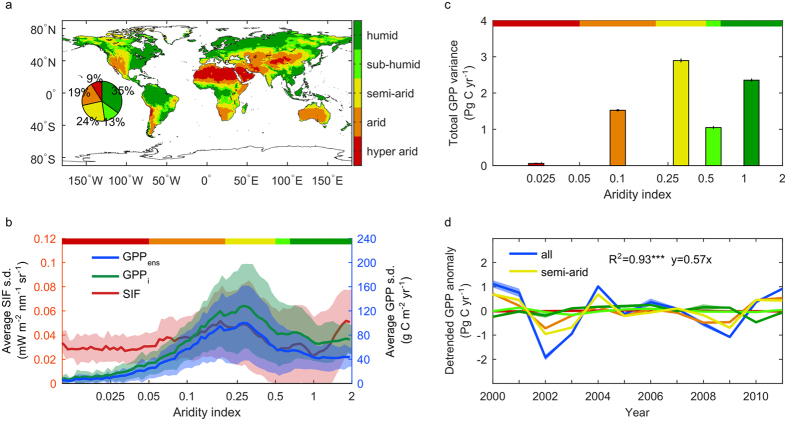
Figure 2.
(a) The aridity map calculated as a ratio between precipitation from GPCC55 and potential evapotranspiration from MOD16 product56. Long-term averages from 2000 to 2013 for both products were used; the classification of aridity regions is based on UNEP (Supporting Information, Table S1). The small pie chart indicates the proportion of each class in the global land area. (b) IAV of GPP ensemble (GPPens), average of GPP IAV from individual models (GPPi) and SIF IAV at different aridity indices, with the shaded area indicating one s.d. of variation. (c) The contribution of total GPP variability from different aridity classes. Error bars stand for one s.d. using different orders of ensemble. (d) Detrended GPP anomaly for global and 5 individual aridity regions, from 2000 to 2011. GPP ensemble comes from all models, and the shaded area indicates the range of s.d. from different orders of weight (1st, 2nd, 4th, see Methods). Maps were created using Matlab R2016a (http://www.mathworks.com/products/matlab/).

