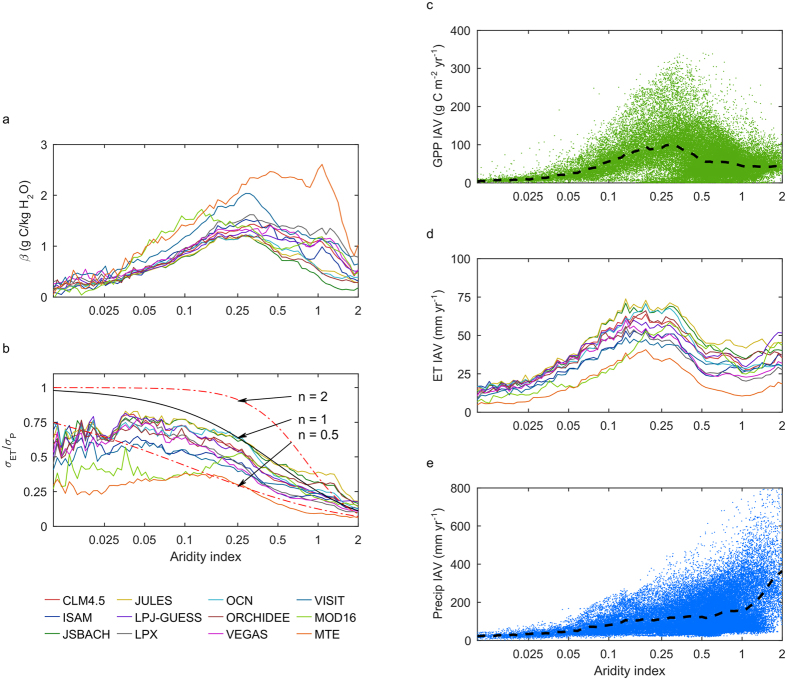
Figure 4. Decomposition of GPP IAV into ET IAV and precipitation IAV, and their relationship with aridity index.
(a) Ratios of interannual anomalies of GPP to anomalies of ET (β) as a function of aridity index. Each line represents the mean value at each AI value. (b) Change in ET induced by change in precipitation, two dashed red line and the solid black line represent the prediction from Budyko framework with different n values. (c) GPP IAV from 2nd order ensemble (γ = 2) of all models versus AI, the black dashed line represents mean value at each AI value. (d) ET IAV from all 12 ET products versus AI. (e) Precipitation IAV and its relationship with aridity index, the black dashed line represents the mean value at each AI value.

