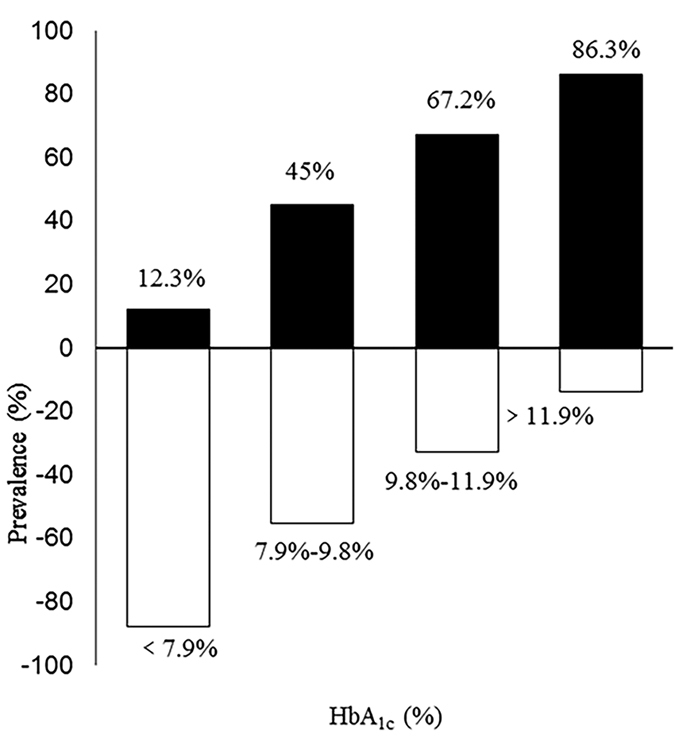
Figure 1. The prevalence of type 2 diabetic ketosis with increasing levels of HbA1c.

HbA1c was plotted in quartiles with the HbA1c levels set at ≤7.9%, 7.9–9.8%, 9.8–11.9%, and ≥11.9%. Black bars = proportions of patients with type 2 diabetic ketosis. White bars = proportions of type 2 diabetes patients without ketosis.
