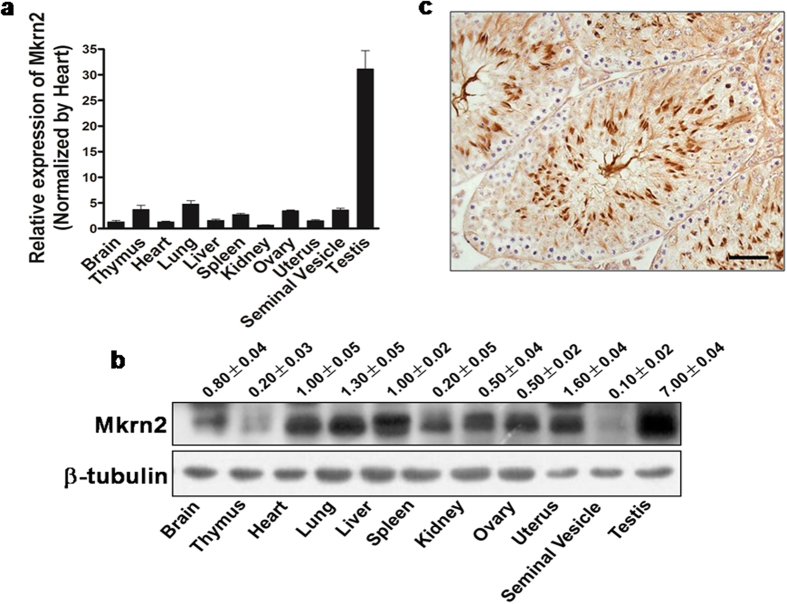
Figure 1. Expression profile of Mkrn2 in mice tissues.
(a) Mkrn2 mRNA levels in different tissues were analyzed by RT-qPCR and normalized to those in liver tissue. Data in the figure are represented as means ± SE. from four mice. (b) The Mkrn2 protein levels in mouse organs were detected by immnuoblotting. β-Tubulin was used as a loading control. The blotting density was normalized to that of the liver. (c) The location of Mkrn2 inthe testis of 4-week mice was determined using immunohistochemistry. Scale bar = 20 μm.

