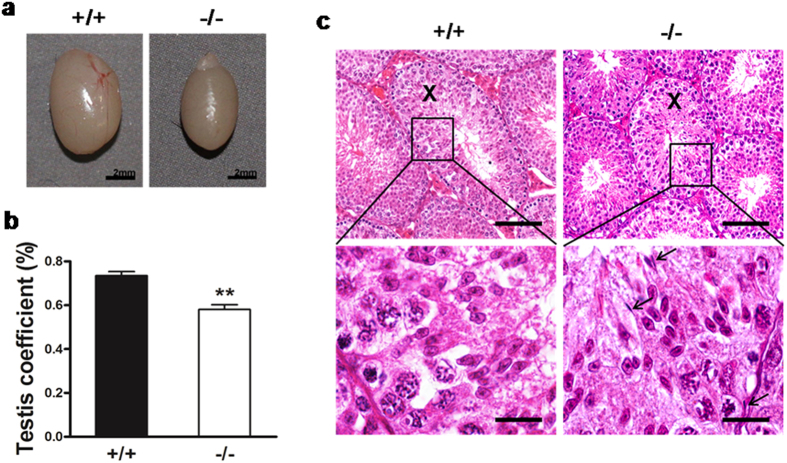
Figure 5. Analysis of Mkrn2 knockout mouse testes.
(a) Macroscopic appearance of testes. Scale bar = 2 mm. (b) Testis weights. The net testis weight was normalized to body weight. Data arerepresented as the means ± SE. From six testes for each phenotype. Error bars represent SE. ** P < 0.01 (two-tailed Student’s t test). (c) Hematoxylin& eosin (H&E) staining sections of Stage X testicular tubules. Arrows indicate the spermiation failure spermatids in Mkrn2 knockout testes (right); these sperm should have been released at Stage X, as observed in the wild-type testes (left). Scale bar: Upper panel, 100 μm; Bottom panel, 20 μm.

