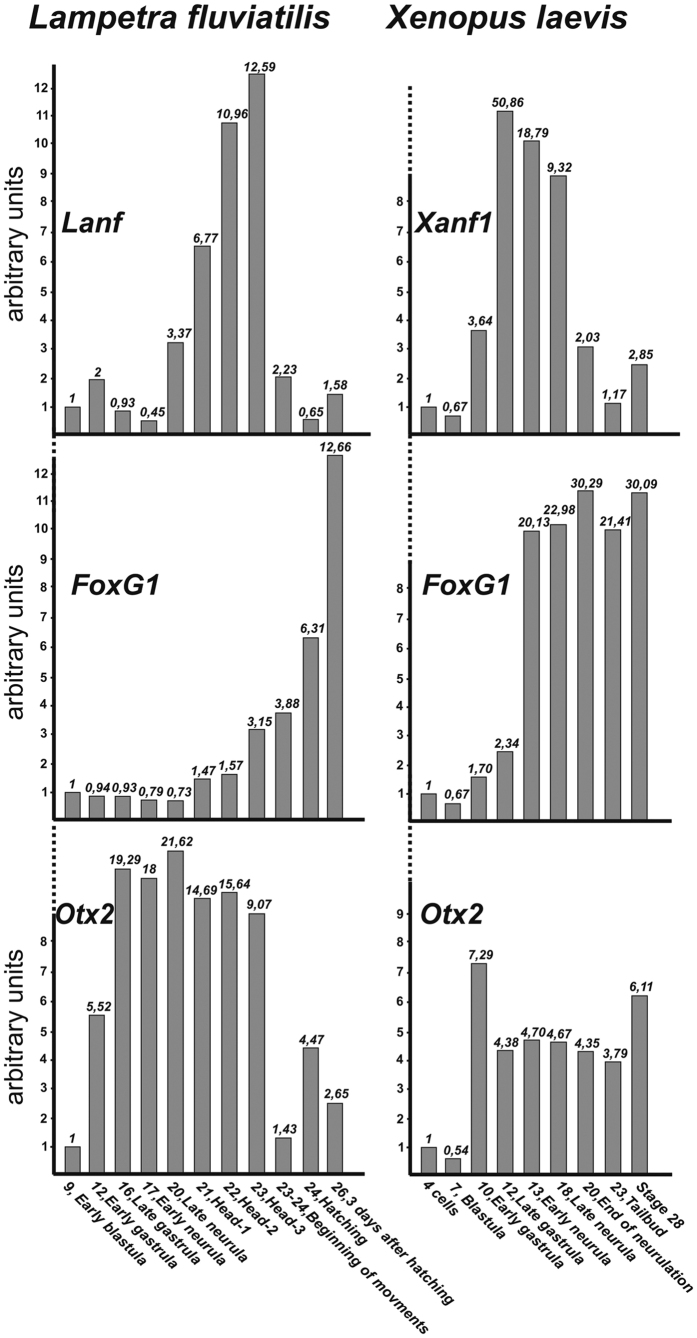
Figure 2. Comparison of the temporal expression pattern of Lanf with those of FoxG1 and Otx2 in lamprey (L. fluviatilis) and frog (X. laevis).
qRT-PCR data obtained for Anfs (Lanf and Xanf1), FoxG1 and Otx2 in whole embryos collected at the stages indicated below were normalized relative to qRT-PCR data obtained for the housekeeping genes EFalfa and ODC. Stage numbers are indicated according to17,34. All data are from three experiments, average values are shown.

