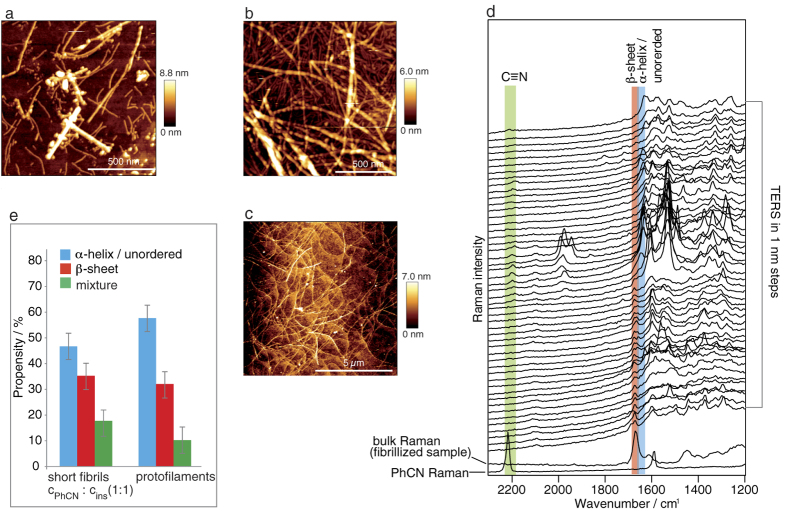
Figure 3. AFM and TERS measurements of insulin fibrils grown at pH 2.5 for 2.5 h in the presence of PhCN.
(a) Representative topography (of 5 areas) of fibrils generated using PhCN (cPhCN: cinsulin 1:1). (b) Representative topography (of 5 areas) of the sample shown in (a) after 6 d at 8 °C. (c) Topography of insulin mature fibrils grown under undisturbed conditions. (d) 50 of 70 TERS raw spectra (tacq = 5 s) recorded along a single short fibril (topography see Supplementary Fig. S3a) with modes of specific interest highlighted: blue, a-helix/unordered structure; red, b-sheet structure; green, PhCN. The two spectra at the bottom show the bulk Raman spectrum of the sample and the Raman spectrum of neat PhCN, (tacq = 30 s). (e) Propensities of the different secondary structures in 230 TERS spectra recorded on 4 short fibrils in comparison to the values reported for protofilaments16. Error bars indicate the maximum deviation.

