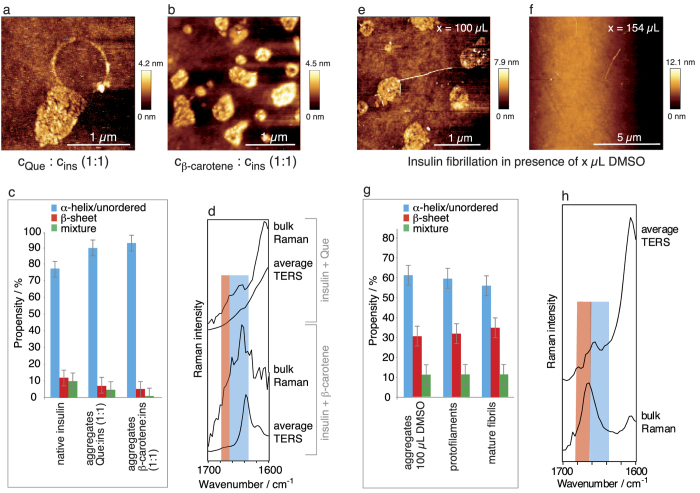
Figure 4. AFM, TERS and Raman measurements of aggregates generated during insulin fibrillation in the presence of Que and β-carotene and DMSO.
(a) Detailed AFM topography of aggregates generated during insulin fibrillation in the presence of Que (cQue: cinsulin 1:1). (b) Representative AFM topography (of 5 areas) of aggregates generated during insulin fibrillation in the presence of β-carotene (cβ-carotene: cinsulin 1:1). (c) Propensities of the different secondary structures based on 238 (Que condition) and 262 (β-carotene condition) TERS spectra recorded from 4 and 3 aggregates, respectively, from the insulin fibrillation. The Que or β-carotene fibrillation conditions and native insulin are compared. Error bars indicate the maximum deviation. (d) Bulk Raman and average TERS spectra from the samples in (a,b); the regions of α-helix/unordered structures and β-sheet structures are highlighted blue and red, respectively. Representative AFM topography (of 5 areas) of insulin fibrils generated in the presence of (e) 100 μL of pure DMSO and (f) 154 μL of pure DMSO. (g) Propensities of the different secondary structures in 248 TERS spectra recorded from 5 aggregates in comparison to the values reported for protofilaments and mature fibrils16. Error bars indicate the maximum deviation. (h) Bulk Raman and average TERS spectra from the fibrillation in the presence of 100 μL of pure DMSO; the regions of α-helix/unordered structures and β-sheet structures are highlighted in blue and red, respectively.

