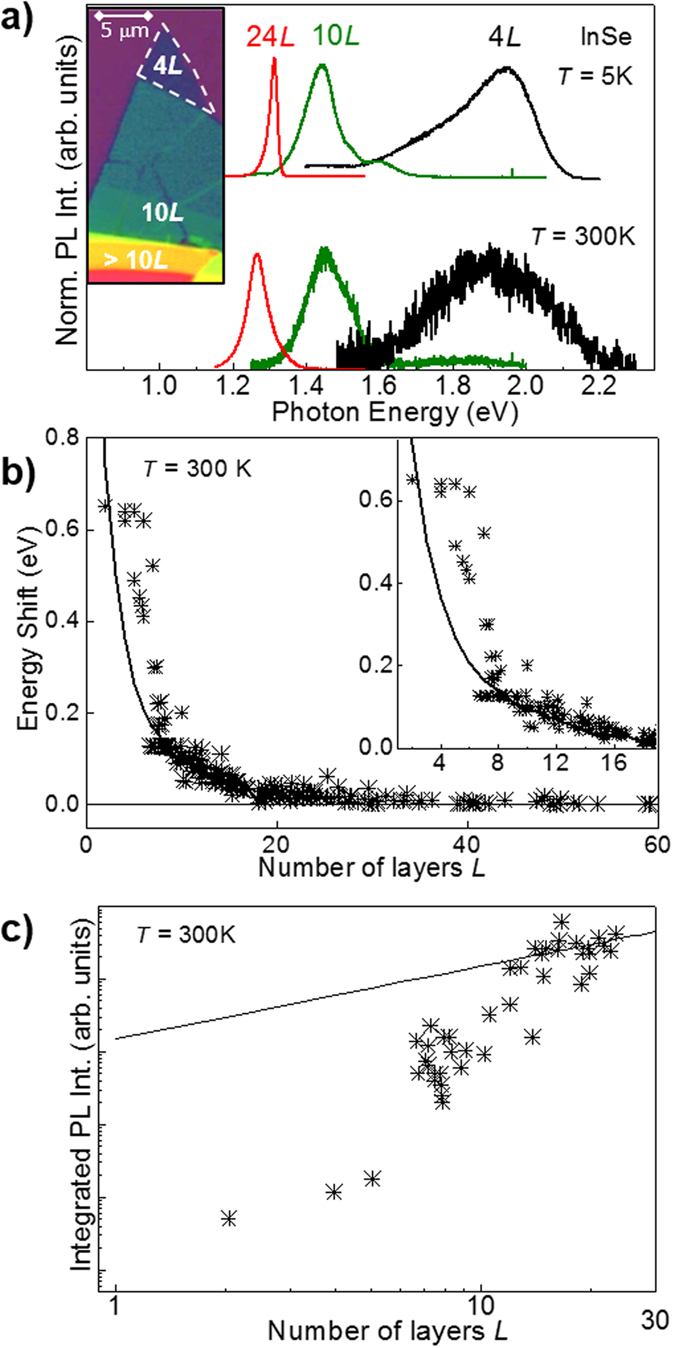
Figure 3. Quantum energy shift of band-to-band optical transitions in InSe.

(a) Normalized μPL spectra for InSe nanosheets with L = 4, 10 and 24 layers at T = 5 K and 300 K. The inset is an optical image of the nanosheet with sections of thickness L = 4, 10 and >10 layers. (b) Calculated (lines) and measured (symbol) energy increase of the band gap of InSe with decreasing L. Inset: Same as in part a) but for small L. (c) PL integrated intensity versus L. The line represents the relation αL, where α is a constant absorption coefficient.
