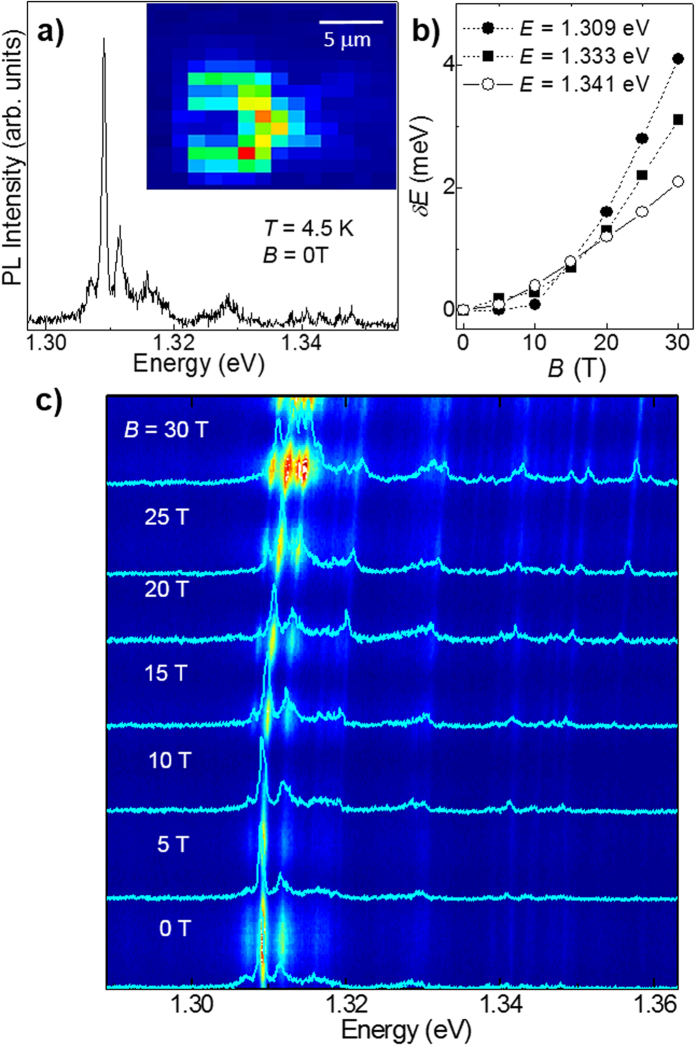
Figure 4. Narrow photoluminescence emission lines in InSe.
(a) Narrow μPL lines at magnetic field B = 0 T and T = 4.2 K. The inset shows a μPL map acquired at the energy of the μPL line at 1.309 eV. (b) Energy shift δE versus B for three representative μPL lines. The dotted lines are guides to the eye. (c) Colour map of the PL intensity versus B and photon energy. The μPL spectra for representative B are overlapped on the colour map. The magnetic field is parallel to the c-axis of InSe and the experiment is conducted in the Faraday geometry.

