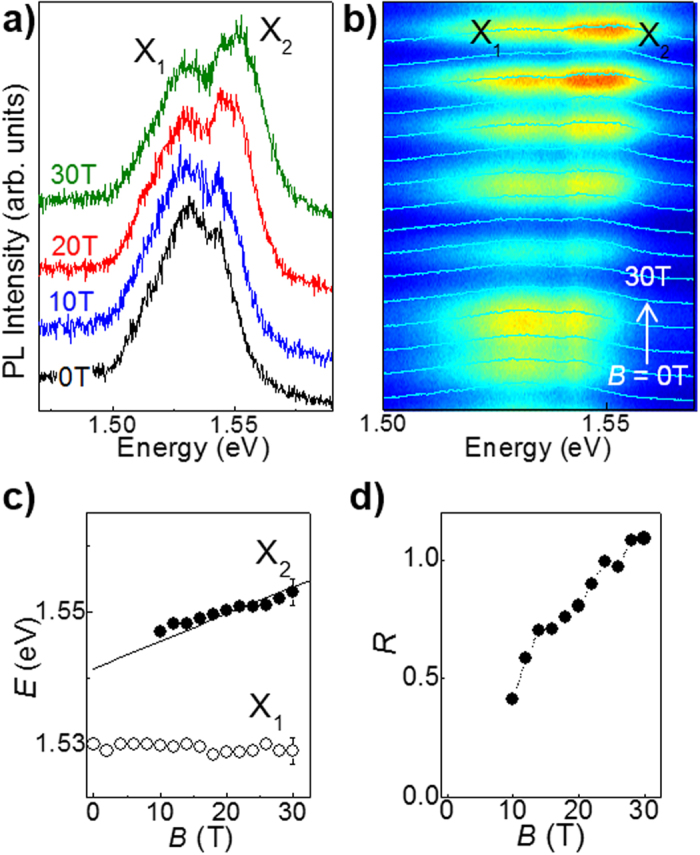
Figure 6. Magneto-photoluminescence of InSe nanosheets.

(a) Normalized μPL spectra at magnetic field B = 0, 10, 20, and 30 T for an InSe flake with L ~ 5 layers in the Faraday geometry and B parallel to the c-axis (T = 4.2 K). (b) μPL spectra overlapped over a colour map of the PL intensity versus B and photon energy. The oscillations in the μPL intensity with B are due to the use of optical fibres (see Methods). The spectra are shown for B increasing from 0 to 30 T in steps of 2 T. (c) Energy peak position of the X2 and X1 bands and (d) ratio of their intensity, R, versus B. The line in part c) describes the linear shift of the X2 band, i.e. E ∝  , where μ⊥ = 0.14me is the reduced mass of the exciton. The dotted line in part d) is a guide to the eye.
