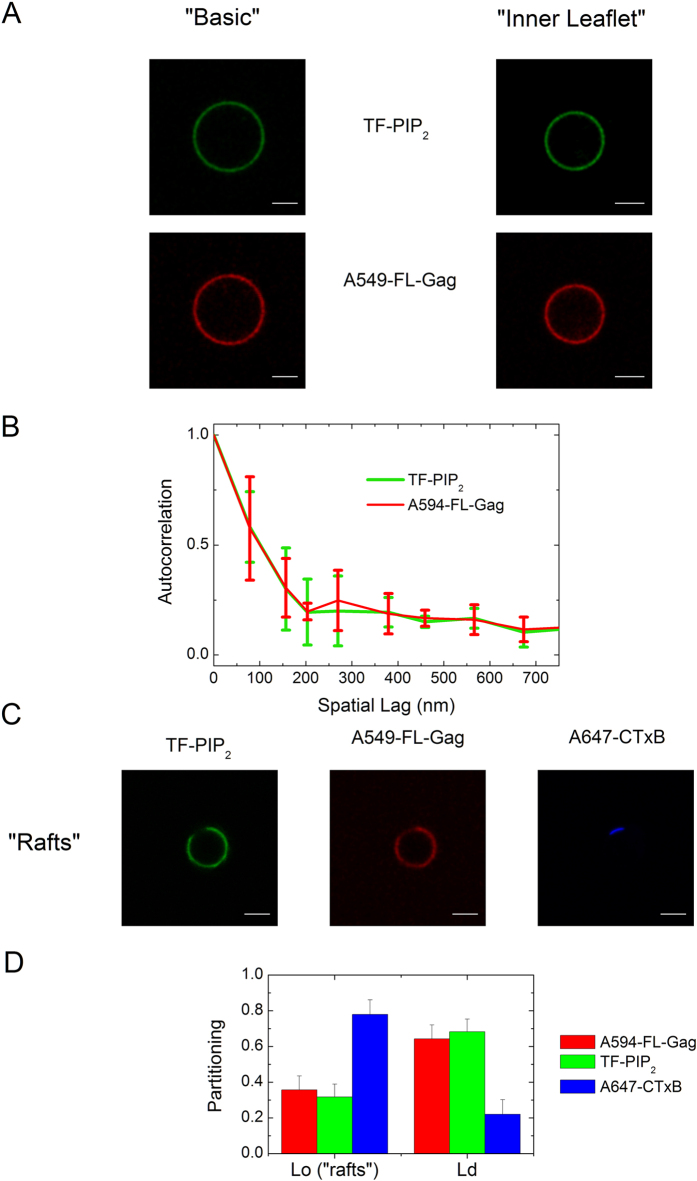
Figure 3. Fluorescence distribution of TF-PIP2 and A594-FL-Gag on “Basic”, “Inner Leaflet” and “rafts-mimicking” GUVs.
(A) Left, localization of TF-PIP2 (green) and A594-FL-Gag (red) in a “Basic” composition GUV. Right, localization of TF-PIP2 (green) and A594-FL-Gag (red) in an “Inner Leaflet” composition GUV, (scale bar 5 μm). (B) Spatial autocorrelation of the fluorescence intensities of TF-PIP2 (in green) and A594-FL-Gag(in red) for the “Basic” composition calculated using eq. 2, (mean ± s.d., n = 4). (C) Localization in “Raft” GUVs (F) of TF-PIP2 (green), A594-FL-Gag (red) and GM1, a raft partitioning ganglioside, labeled with alexa 647 cholera toxin B (A647 Ctx-B)(blue), (scale bar 5 μm). (D) Partitioning in Lo and Ld phase of “raft” GUVs for A-594 FL, TF-PIP2 and A647-CtxB (mean ± s.d., n = 25) as determined using eq. 3.

