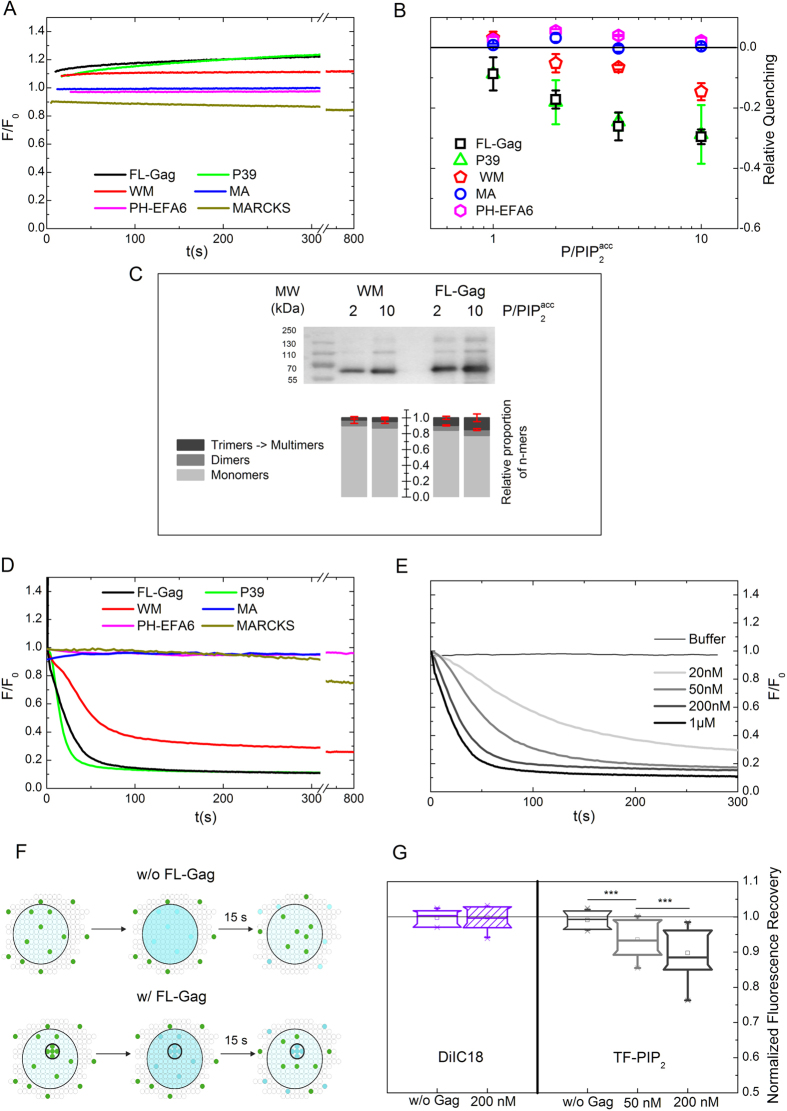
Figure 4. PIP2 nanoclustering induced by Gag self-assembly on basic composition lipid membranes.
(A) Typical time course of TF-PIP2 fluorescence on LUVs after addition of the different proteins or peptide at a  = 10. (B) Relative quenching values observed for FL-Gag, its mutant, MA and PH-EFA6 on LUVs (mean ± s.d. values of n ≥ 3 for each
 conditions, except P39 (2 ≤ n ≤ 3)). (C) Differences in WM and FL-Gag self-assembly efficiency on LUV at two different
  ratio. Bar graph represents the mean signal observed for monomers dimers and trimers & multimers obtained from independent experiments (mean ± s.d., n = 3). (D) Typical time course of TF-PIP2 fluorescence on SLBs after addition of 1 μM of the different proteins or peptide. (E) Fluorescence time course of TF-PIP2 after addition of increasing FL-Gag concentrations. (F) Schematic representation of the effect of an immobile fraction on the fractional recovery. Upper part, without Gag, fractional recovery = 1. Lower part, with Gag, self assembled Gag trapped PIP2 are still in the bleached area leading to a normalized fractional recovery < 1. (G) Plot box of the fractional recoveries obtained from FRAP measurements before and after addition of increasing concentrations of FL-Gag on SLB containing either DiIC18 as a lipid analogue control (left) or TF-PIP2 (right). (Boxes are 25,75% with bars max and min values of n ≥ 15, ***p ≤ 10−3 for Student t-test at 0.01 confidence level).

