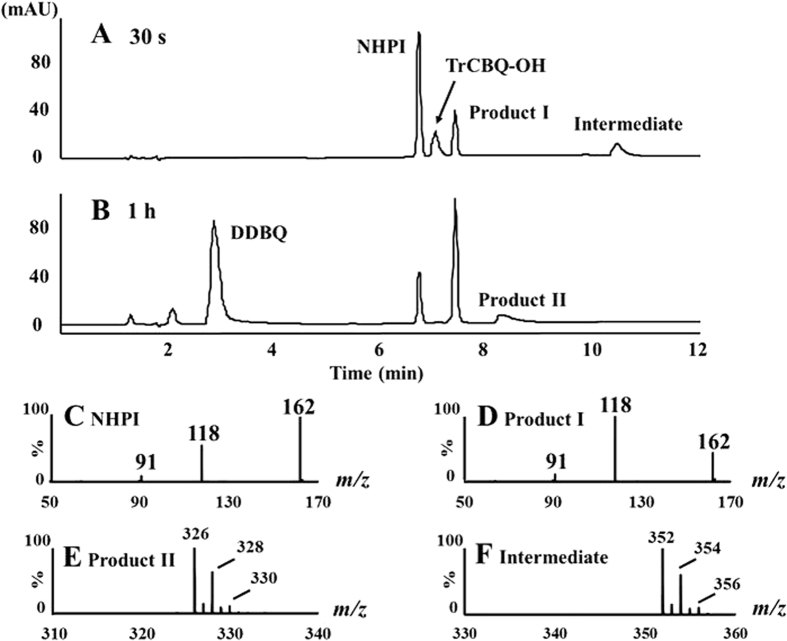
Figure 3. Analysis of the NHPI/TCBQ reaction products of using the HPLC-MS method.
(A,B) The HPLC profile of the reaction of TCBQ (0.2 mM) with NHPI (0.4 mM) in phosphate buffer (pH 7.4, 0.1 M). (C) The ESI-Q-TOF-MS-MS spectrum of NHPI. (D) The ESI-Q-TOF-MS-MS spectrum of the reaction product I with a retention time of 7.5 min in HPLC. (E) The ESI-Q-TOF-MS spectrum of reaction product II with a retention time of 8.5 min characterized with 2-chlorine isotope clusters at m/z 326. (F) The ESI-Q-TOF-MS spectrum of reaction intermediate with a retention time of 10.6 min with 2 chlorine isotope clusters at m/z 352.

