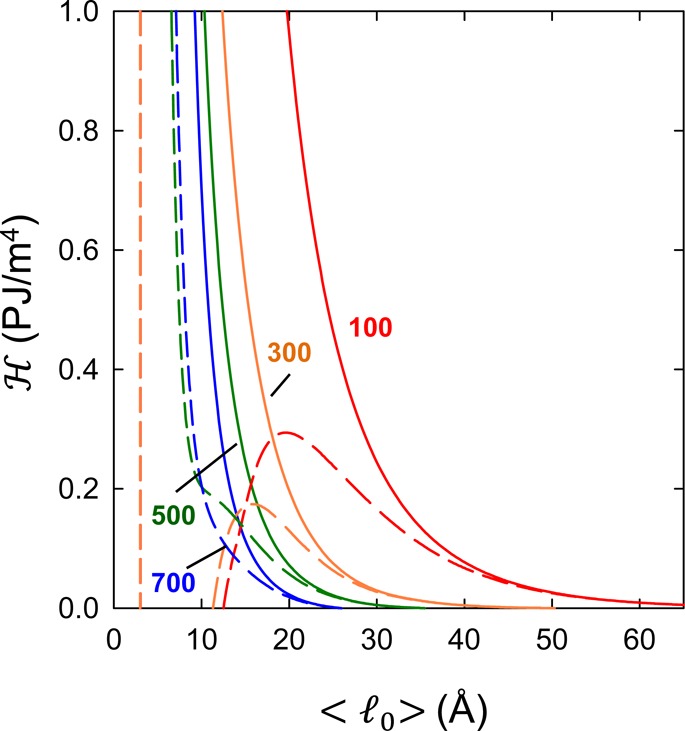
Figure 3.

Behavior of the Hessian  ≡
∂2fvar/∂l02 as a function of membrane equilibrium
spacing ⟨l0⟩ and salt concentrations
for CC (solid lines) and CP (dashed lines) boundary conditions. Colors
represent different salt concentrations, given in units of mM by numbers
next to the data. All the CC curves show a non-negative Hessian, and
the Gaussian theory on which they are based is stable. The CP curves
show a more complicated behavior, often exhibiting negative values
of the Hessian, signaling a breakdown of the Gaussian theory.
