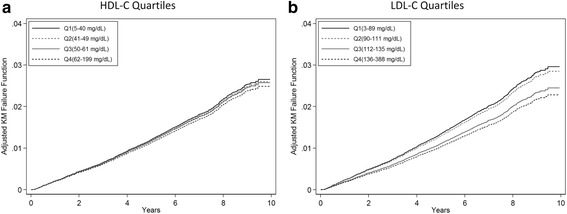
Fig. 1.

Adjusted Kaplan–Meier (KM) failure curves for time to sepsis by HDL-C and LDL-C quartiles (Q1 = lowest quartile, Q4 = highest quartile). Total of 29,690 participants. (a) High-density lipoprotein cholesterol (HDL-C) and (b) low-density lipoprotein cholesterol (LDL-C). All failure functions estimated among White, female, nonsmoking and non-alcohol-consuming participants residing in the nonbelt region, with no history of comorbidities, normal biomarker levels, and no functional status impairments (all binary variables set to zero and all categorical variables set to the reference groups)
