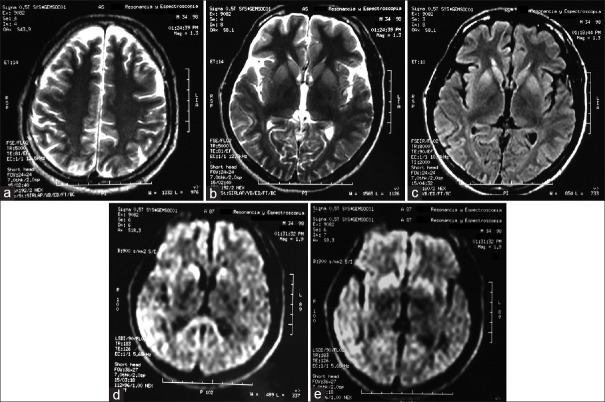
Figure 3.
Note the magnetic resonance imaging (MRI) of the skull in the axial T2 sequence where data loss of corticosubcortical volume are observed diffusely (a). MRI in T2 sequence where hyperintensity data are identified at the level of caudate nucleus heads and putamen bilaterally with tendency to symmetry (b). MRI in T2 fluid attenuated inversion recovery (FLAIR) sequence where hyperintensity data are identified at the level of caudate nucleus heads and putamen bilaterally with tendency to symmetry (c). MRI in sequence diffusion (diffusion weighted imaging) where diffusion restriction is identified at the level of caudate nucleus heads, splenius of the corpus callosum (d). MRI in sequence diffusion (diffusion weighted imaging) where diffusion restriction is identified at the level of right temporoparietal cortical region predominantly right cortical region and in both putamen which tends to symmetry (e)

