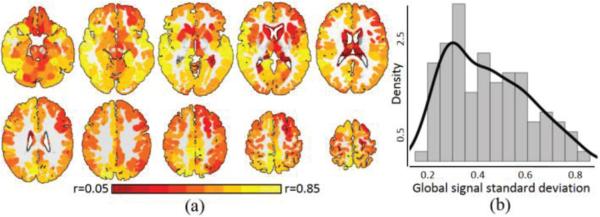
Fig. 2.
Characteristics of the global signal. A) Greater than 98% of the grey matter showed significant correlations with the global signal, with an average correlation of r=0.43±0.14. Warmer colors represent greater correlation with the global signal. B) The distribution of the standard deviation of the global signal showed a heavy tail. The black line represents a kernel density estimate of the distribution.

