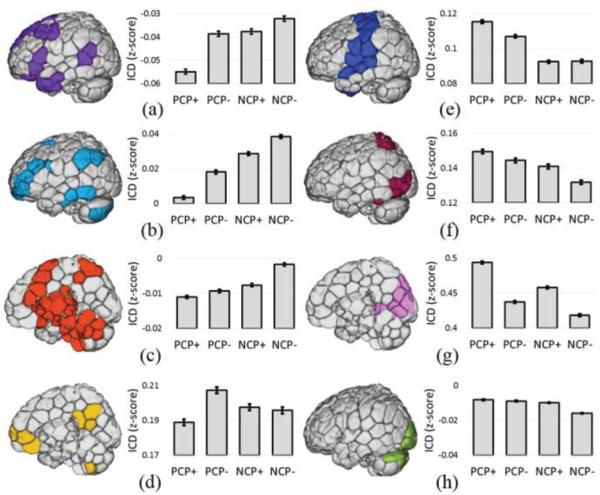
Fig. 6.
RSN analysis of critical points. Whole-brain connectivity averaged across eight canonical RSNs revealed that specific networks exhibit the greatest connectivity during specific critical points. A) The medial frontal (MF) network, B) the frontoparietal (FPN) network, and C) the sub-cortical/salience network showed the greatest whole-brain connectivity during NCP(−)'s. D) The PCC-PFC network showed the greatest whole-brain connectivity during PCP(−)'s. E) The motor network, F) visual association network, and G) visual network showed the greatest whole-brain connectivity during PCP(+)'s. H) The inferior visual network was no associated with any critical point in particular.

