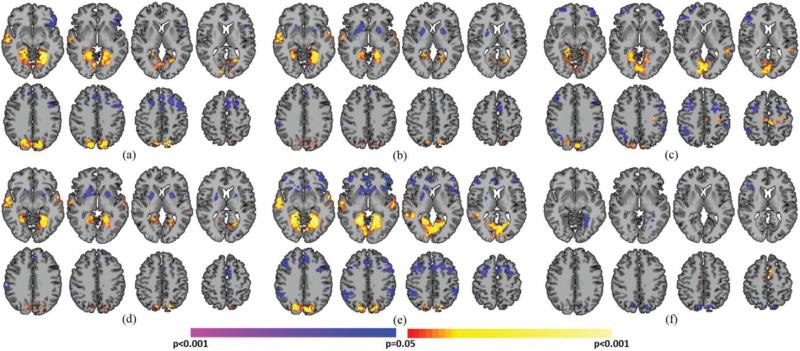
Fig. 7.
Critical point analysis using a standard deviation threshold of 0.5. Pairwise comparisons of A) PCP(+)'s and PCP(−)'s, B) NCP(+)'s and NCP(−)'s, C) PCP(+)'s and NCP(+)'s, D) PCP(−)'s and NCP(−)'s, E) PCP(+)'s and NCP(−)'s, and F) PCP(−)'s and PCP(+)'s revealed similar differences as in the main analysis. All results shown for p<0.05 corrected for multiple comparisons.

