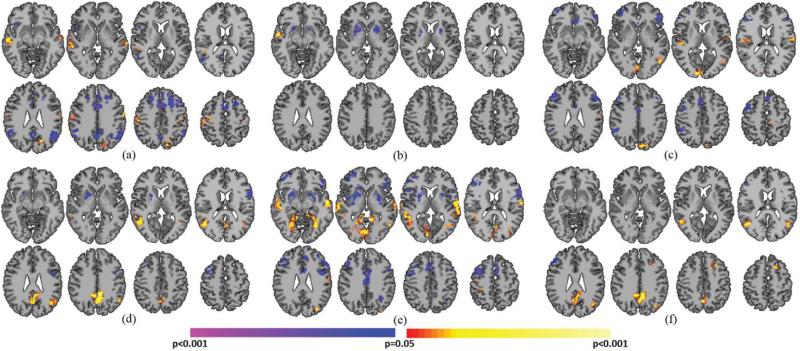
Fig. 8.
Critical point analysis using a standard deviation threshold of 1.5. Pairwise comparisons of A) PCP(+)'s and PCP(−)'s, B) NCP(+)'s and NCP(−)'s, C) PCP(+)'s and NCP(+)'s, D) PCP(−)'s and NCP(−)'s, E) PCP(+)'s and NCP(−)'s, and F) PCP(−)'s and PCP(+)'s revealed similar differences as in the main analysis. Notably, regions in the DMN are more prominent whereas the fusiform is less prominent at the higher threshold of 1.5 compared to the lower threshold of 0.5 in Fig. 7. All results shown for p<0.05 corrected for multiple comparisons.

