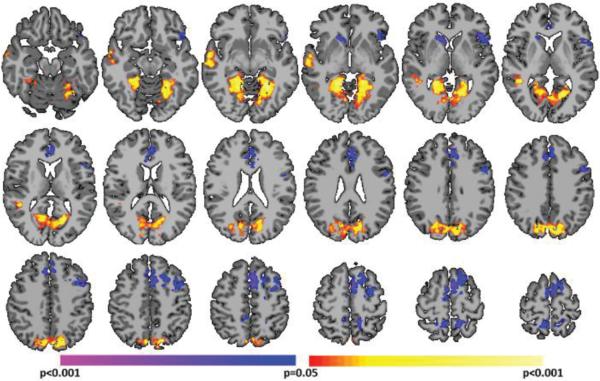
Fig. 9.
Critical point analysis using a standard deviation threshold of 0. At this threshold, only the sign of derivative of the global signal is used to define critical points as no distinction between above or below the mean is made. This comparison of CP(+)'s to CP(−)'s was strikingly similar to the PCP(+)'s vs PCP(−)'s comparison (Fig. 3A). All results shown for p<0.05 corrected for multiple comparisons.

