
Fig. 4.
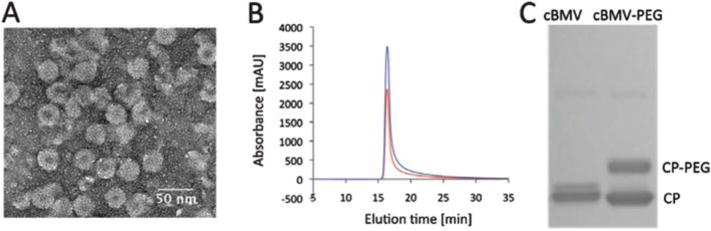
Biochemical characterization of PEG modified cBMV nanoparticles. (A) Transmission electron micrograph of UAc-stained cBMV–PEG particles. (B) Size exclusion chromatogram of cBMV–PEG monitored at 260 nm (blue), 280 nm (red) (Abs 260 : 280 nm = 1.7). (C) SDS-PAGE of cBMV and cBMV–PEG. PEGylated coat proteins (CPs) show lower mobility, ratio of CP-PEG versus (total) CP is (1 : 1) 50%.