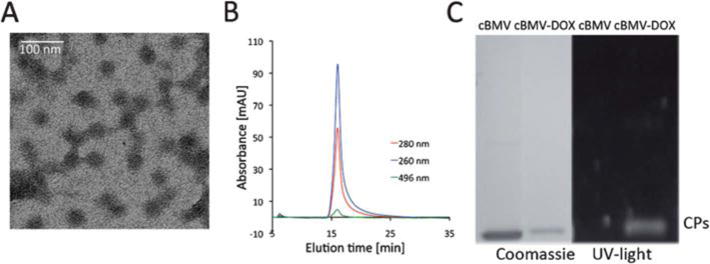
Fig. 6.

Biochemical characterization of cBMV–DOX. (A) Transmission electron micrograph of cBMV–DOX. (B) Size exclusion chromatogram of cBMV–DOX monitored at 260 nm (blue), 280 nm (red) (Abs 260 : 280 nm = 1.7) and 496 nm (green, DOX absorbance). Intact cBMV–DOX fractions were collected and further characterized. (C) SDS-PAGE of cBMV and cBMV–DOX visualized under UV light and white light after Coomassie staining.
