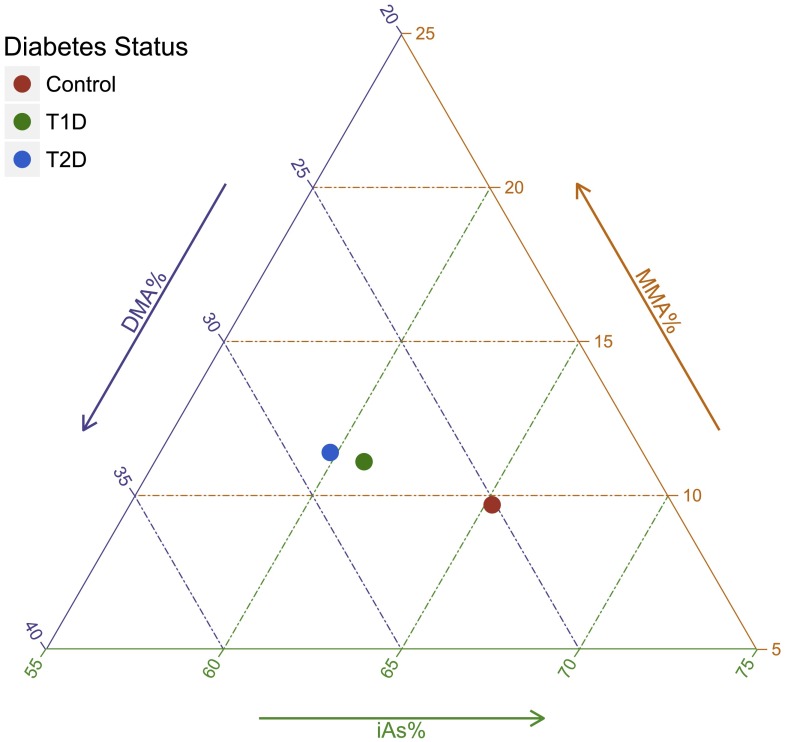
Figure 1.
Triplot representing the compositional means for arsenic metabolism biomarkers (iAs%, MMA%, and DMA%) in control participants and participants with type 1 diabetes (T1D) and type 2 diabetes (T2D). The P values comparing the arsenic metabolism biomarker compositional means were 0.02 for T1D vs. control, 0.12 for T2D vs. control, and 0.87 for T1D vs. T2D.

