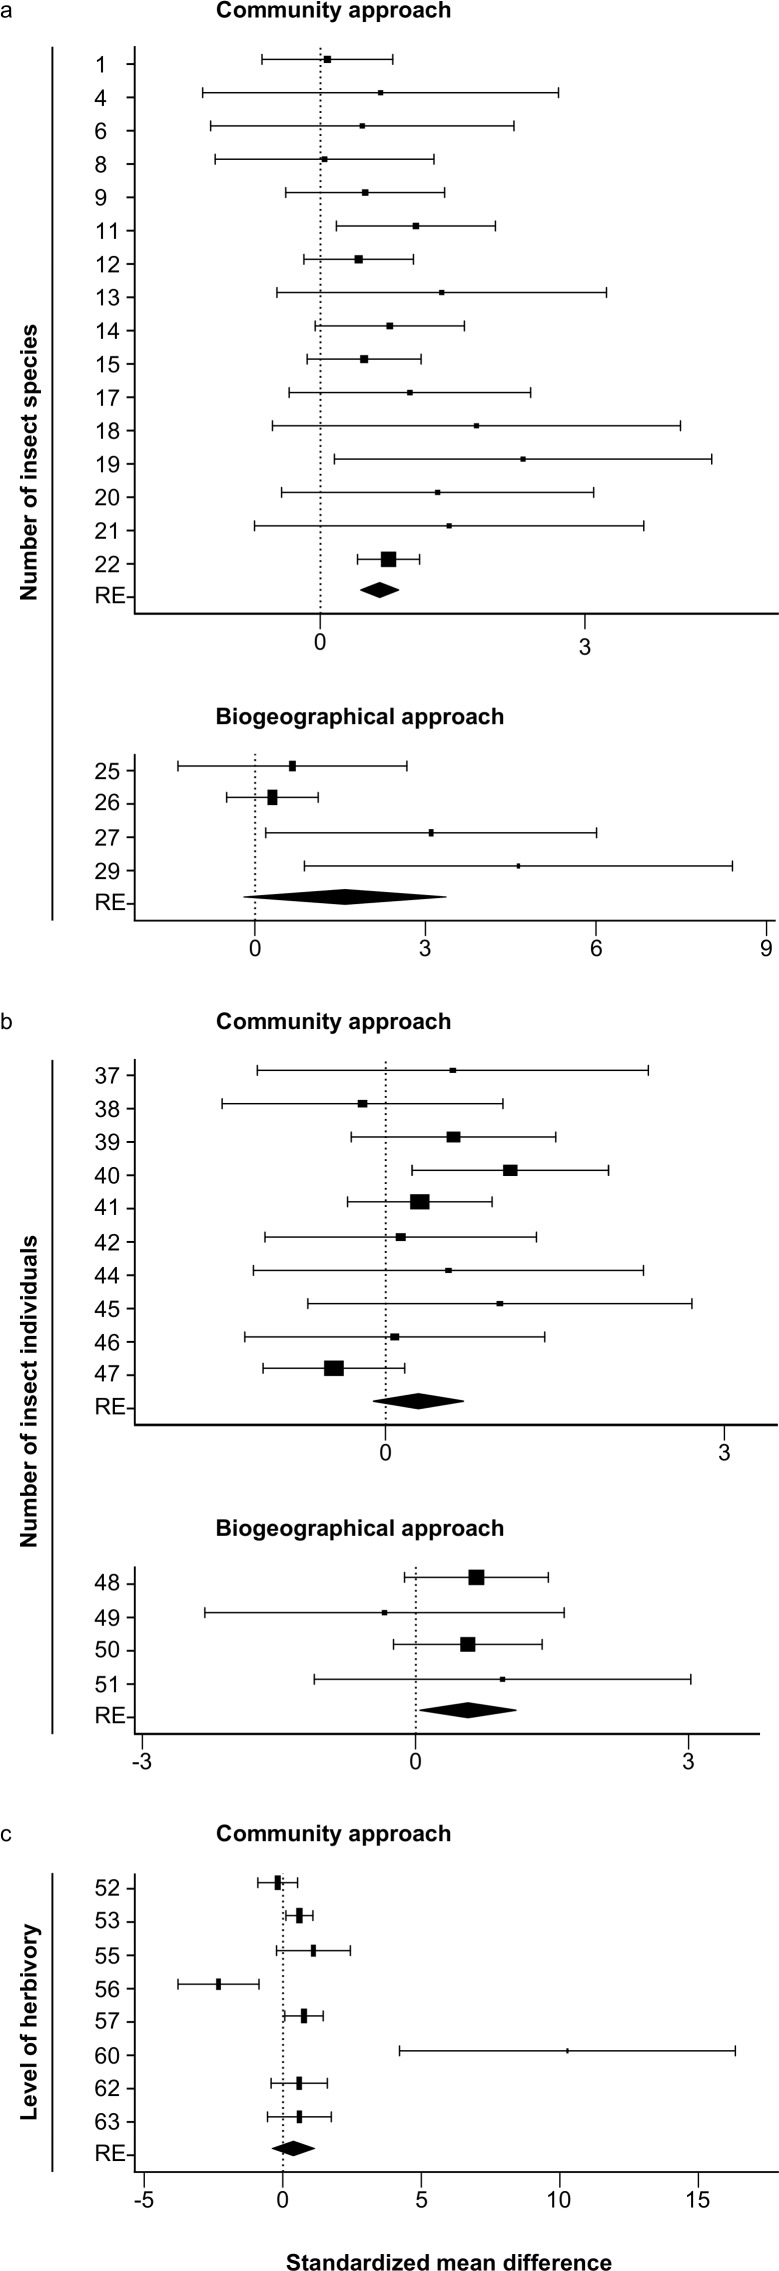
Figure 1. Forest plots of the standardized mean differences of the number of insect species (A), the number of insect individuals (B) and level of herbivory (C) for all studies with sample sizes >1.
The study numbers are shown at the y-axis, and details about the studies can be found in Tables 1–3. RE: random-effects model. Values which are lower than zero, zero or higher than zero, respectively, indicate lower, equal or higher numbers on native than on non-native plants. Diamonds not overlapping the zero line indicate significant differences of the overall random effects (RE) model.

