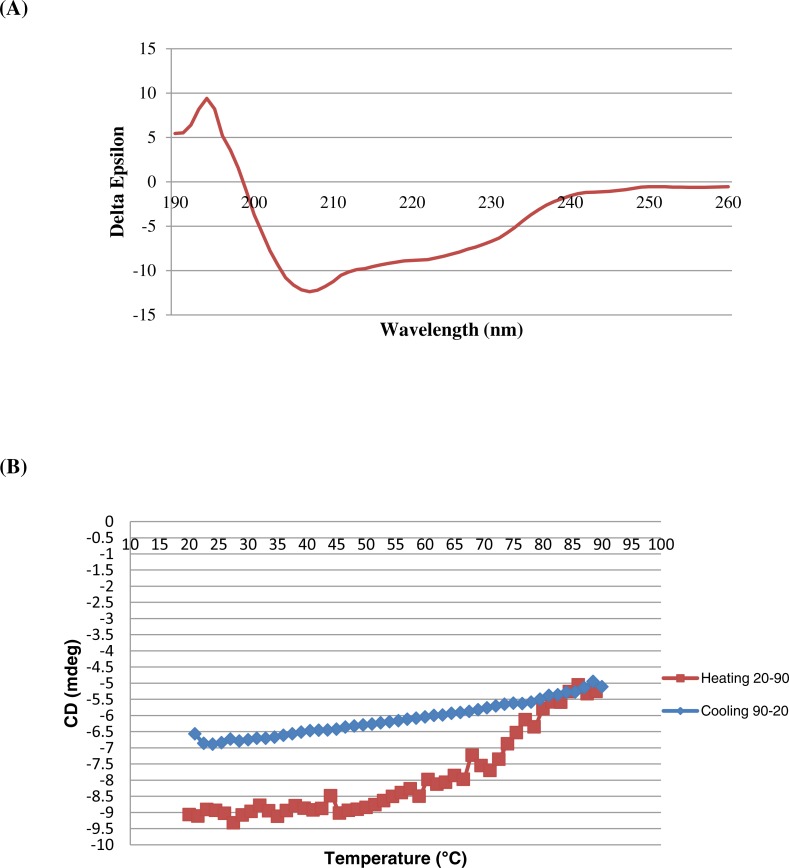
Figure 4. Circular dichroism spectropolarimetry of the His-BipC protein.
(A) Circular dichroism spectra of BipC in 10 mM PB, pH 7.2 at 25 °C. (B) Changes of BipC protein complexes as a function of temperature used to determine the thermodynamics of folding. The viable temperature of BipC confirming the preponderance of random coil confirmation in the structure. The protein was diluted to a concentration of 0.50 mg/ml in 10 mM phosphate buffer (pH 7.2) to record the spectrum.

