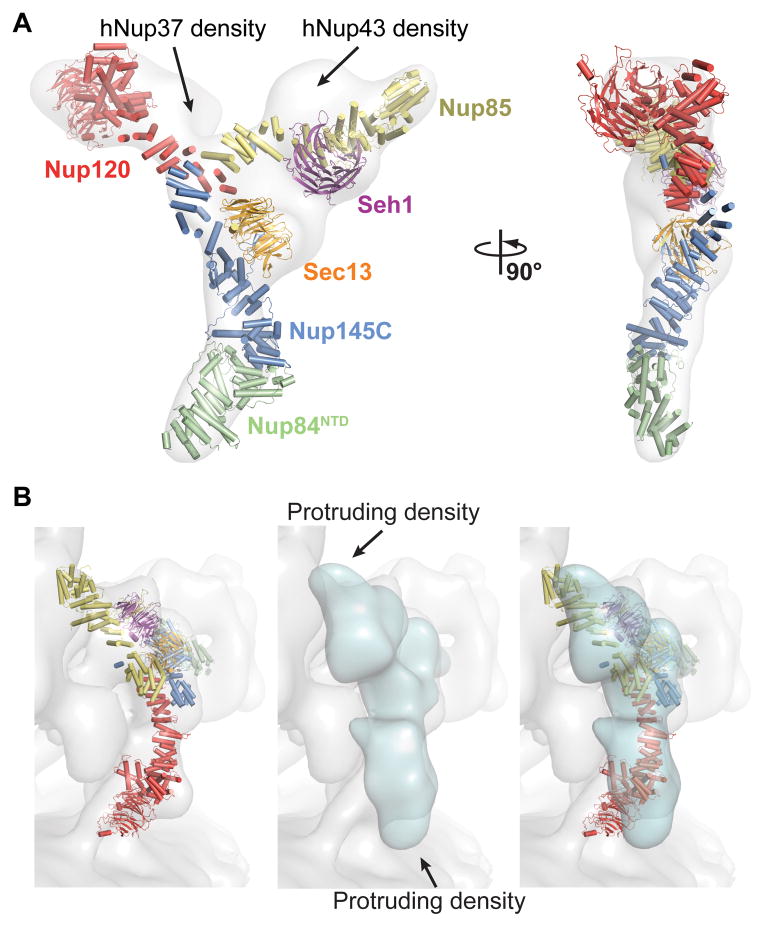
Fig. 3. Comparison of yeast and human CNCs.
(A) Fit of the yeast CNC crystal structure into the human CNC negative-stain EM reconstruction (gray) (3). Arrows indicate density accounted for by the additional human coat nups Nup37 or Nup43. (B) Comparison of the quality of fit for the yeast CNC crystal structure and human CNC EM reconstruction (cyan) into the intact human NPC cryoelectron tomographic reconstruction (gray) (3). Arrows indicate regions where the human CNC EM reconstruction protrudes from the cryoelectron tomographic reconstruction.

