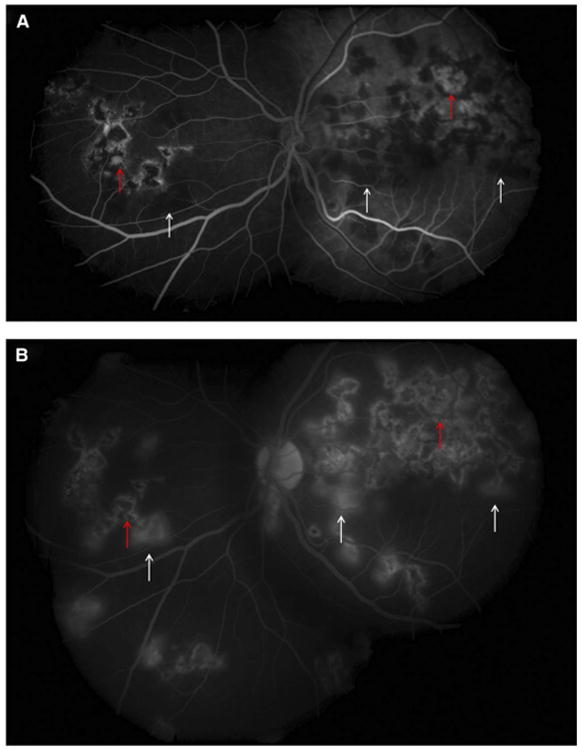
Figure 11.

(A) Fundus fluorescein angiography of the same eye as in Fig. 10 showing active lesions (white arrows) that are hypofluorescent in the early phase. The inactive scars show transmission hyperfluorescence (red arrows). (B) Fundus FA of the same eye as in Fig. 10 showing hyperfluorescence of active lesions in the late phase (white arrows). The inactive scars show transmission hyperfluorescence (red arrows). Reprinted with permission from the American Academy of Ophthalmology (55). Copyright 2012 Elsevier. All rights reserved.
