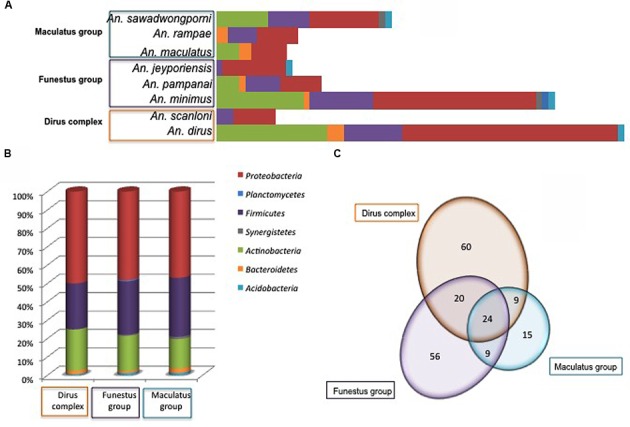
FIGURE 4.

Number of different OTUs per phylum and Anopheles species (A), percent of OTUs in every phyla (B), and distribution of shared and specific OTUs (Venn diagram in C) according to Anopheies complex and groups. The phyla color code is given for (A) and (B).
