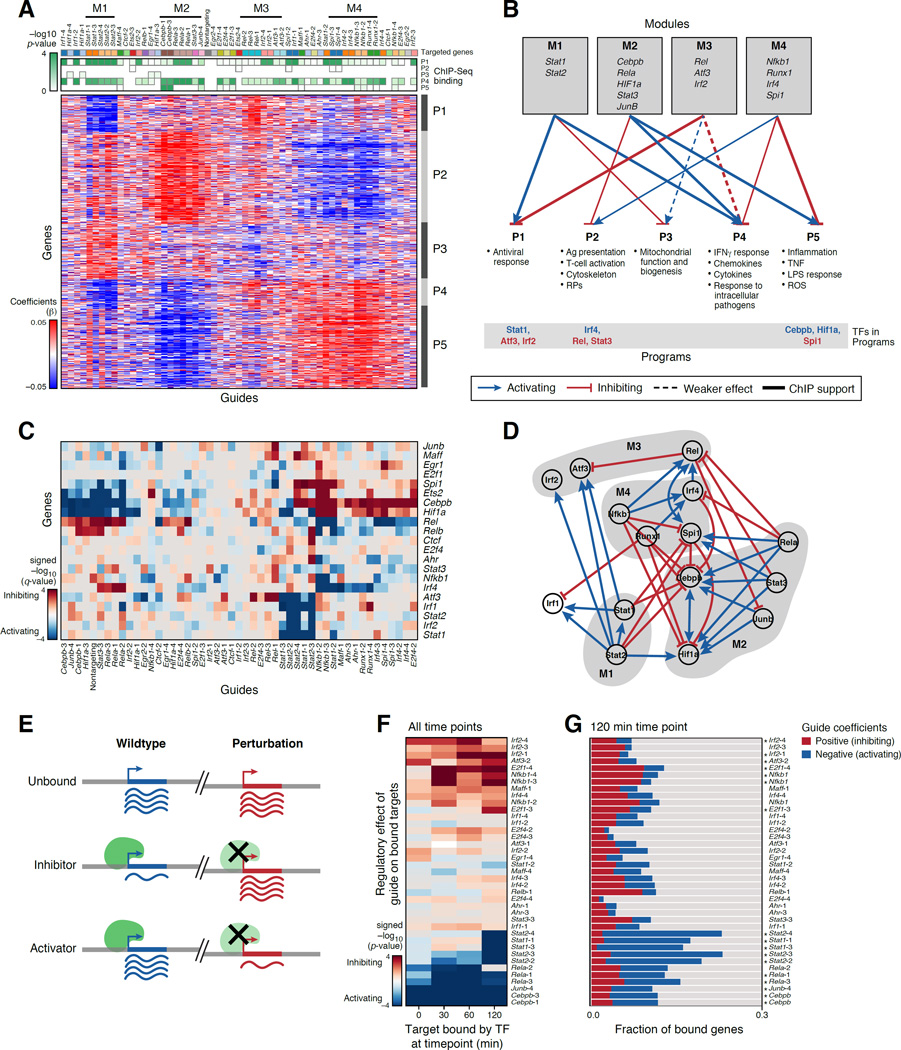
Figure 4. A gene regulatory circuit for BMDCs balances states and responses.
(A,B) TF modules controlling transcriptional programs. (A) Regulatory coefficient (β) of each guide (columns, color coded) on each gene (rows) in a model without cell state covariates. Guides and genes are clustered. Green-white: enrichment of ChIP-bound targets of each TF (columns) in each program (rows). (B) Graph, based on (A), associating TF modules (top) to programs (bottom). Blue/red arrows: module TFs activate/inhibit program (opposite of regulatory coefficient). Bottom: module TFs that are members of program (blue/red: activator/repressor of program). (C,D) TF circuit. (C) Heatmap, as in (A), but only of genes (rows) that encode TFs targeted by guides (columns). (D) Schematic of the associations in (C). Nodes: TFs; Blue/red arrows: activation/inhibition; Modules: grey shading. (E–G) Agreement with ChIP-seq. (E) Expected effects of TF perturbation. (F) Average regulatory effect of each guide (rows) on the genes bound by its target at four time points (columns). (G) Proportion of bound targets at 120 min post-LPS for each TF (rows) that are repressed (blue), activated (red) or unaffected (grey) by the TF’s perturbation. Asterisks: significant (as in F, P < 0.05). See also Figure S4.

