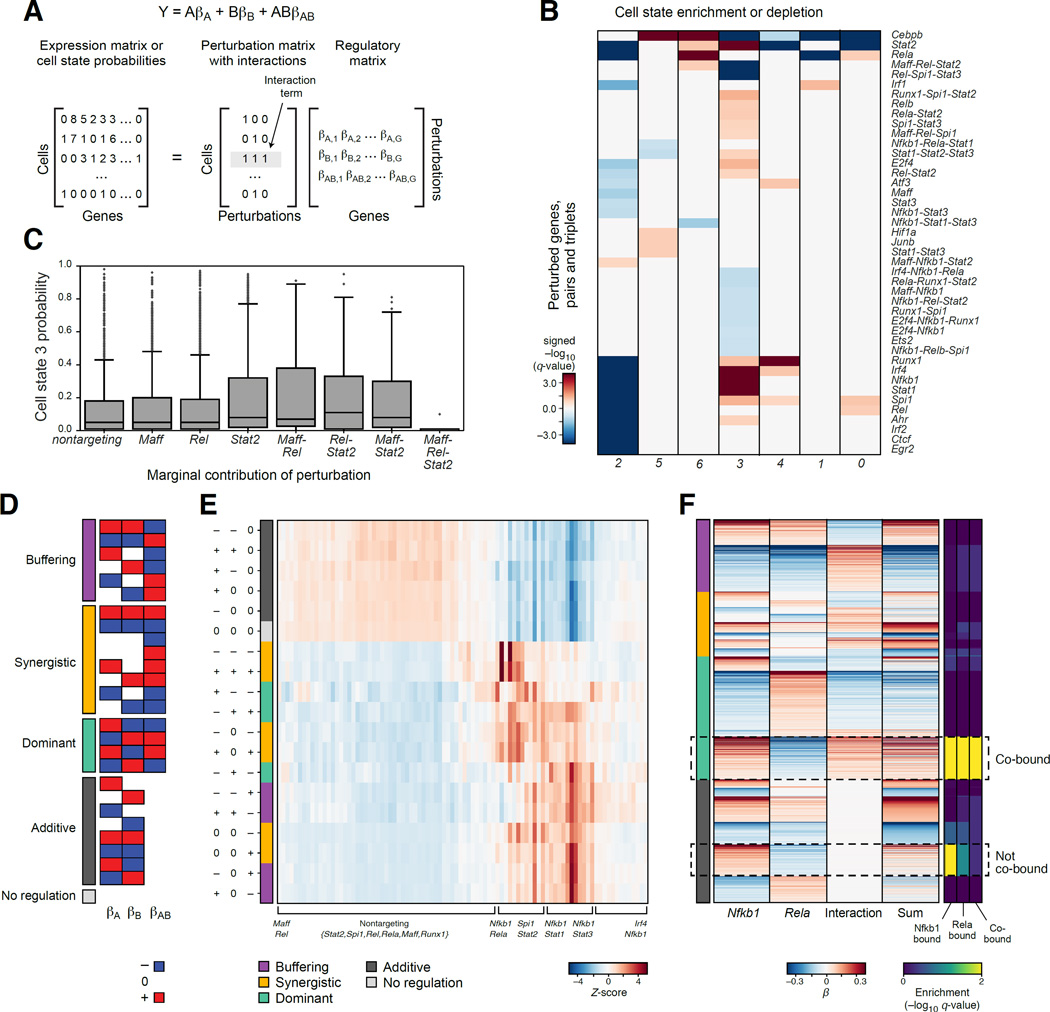
Figure 5. Genetic interactions between TFs in BMDCs.
(A) Model with interactions. (B) TF interactions affecting cell states in stimulated BMDCs. Enrichment (red) or depletion (blue) of single, pair and triplets of guides (rows) in cells in each state (as in Figure 3C). (C) Three-way genetic interaction reduces probability of cell state 3. Probabilities of assignment to cell state 3 of the individual, pair-wise and three-way interactions. (D) 27 genetic interaction categories between two genes (A,B), with positive (red), negative (blue) or no (white) regulatory coefficients marginally associated with each individual guide or their combination. (E) Distribution of target genes in each of the 27 categories (rows) for every pair of perturbations assayed for interaction (columns). (F) Genetic interaction between Rela and Nfkb1 associated with co-binding. Marginal regulatory coefficients for Rela, Nfkb1 and their interaction term for each gene (rows) with at least one non-zero coefficient, sorted by key categories (color code, left). Right: ChIP-seq enrichment of individually bound and co-bound targets in each group.

