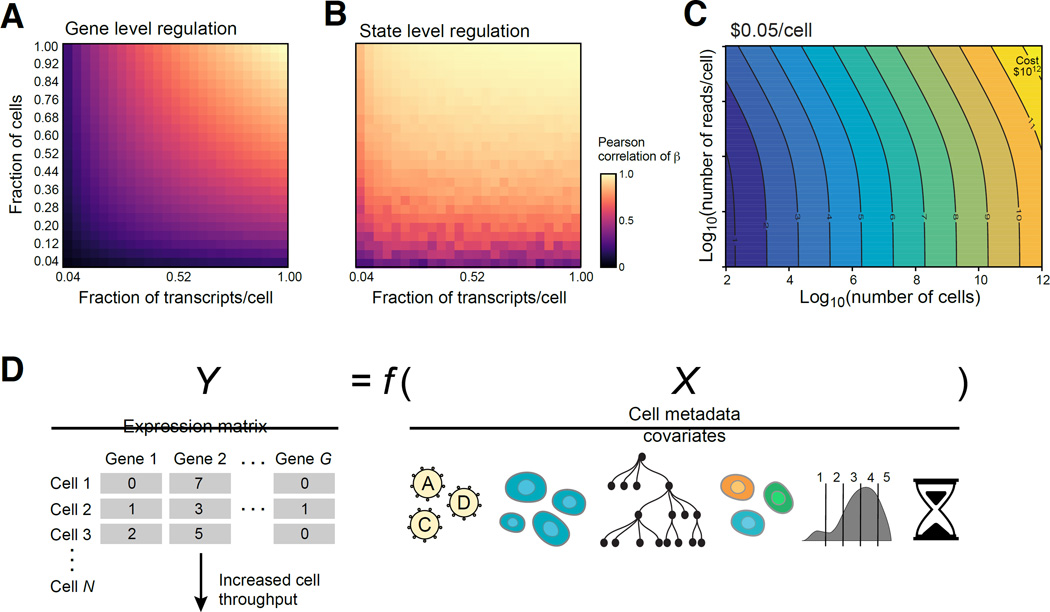
Figure 7. Prospects for Perturb-seq.
(A,B) Saturation analysis. Effect of the number of cells (Y axis) and reads (X axis) on recovery as measured by correlation (color bar) with either the per gene (A) or cell state signature (B) effects observed in the full data. The number of cells per perturbation (1.0) is a mean of 300 and a median of 155 and the number of transcripts per cell (1.0) is a median of 5,074. (C) Tradespace of number of cells (X axis) and measurements per cell (Y axis) required for scaling Perturb-seq. (D) Future extensions, by scaling the number of cells (left) or incorporating other cell covariates (right), such as lineage (tree), marker expression (binned distribution), or time course information (timer), and a more generalized modeling of the relationship between X and Y (Y=f(X)).

