Figure 1.
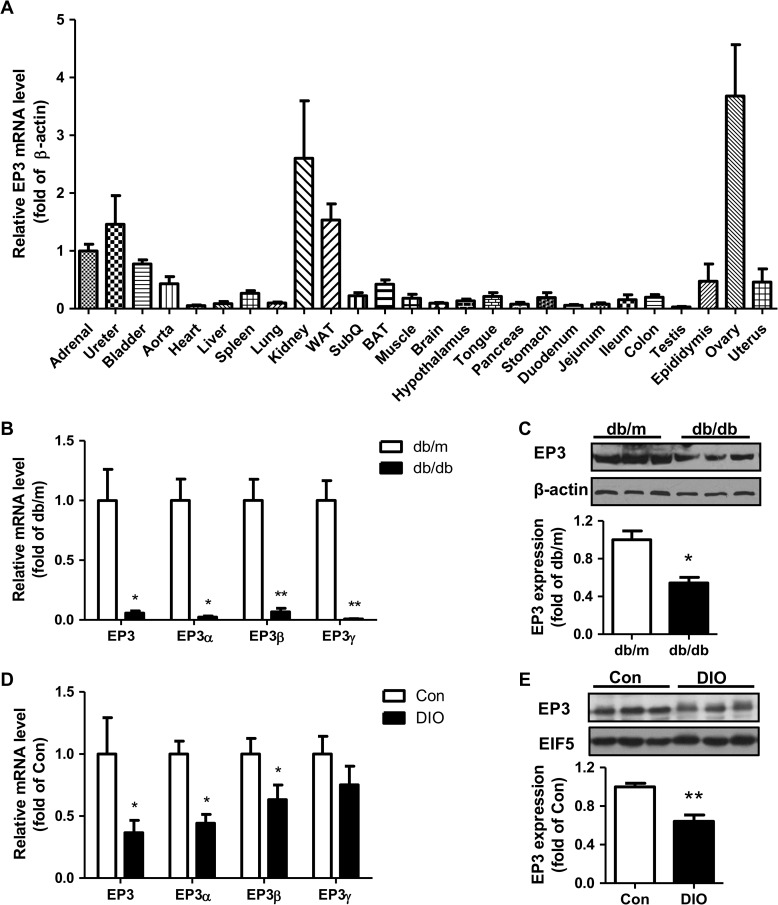
The expression of EP3 receptor in WAT. (A) EP3 expression in various organs and tissues of normal mice. Four male mice and four female mice were used to detect the mRNA levels of total EP3 in 26 organs and tissues by real-time PCR. (B and C) Decreased expression of EP3 receptor in WAT of db/db mice compared with db/m mice. mRNA level was quantified by real-time PCR (B, n = 5 in each group) and protein level was detected by western blot (C, n = 3 in each group). The lower bargraph in C is the quantification of western blot. (D and E) Decreased expression of EP3 receptor in WAT of DIO mice compared with control diet mice. mRNA level was quantified by real-time PCR (D, n = 10 in each group) and protein level was detected by western blot (E, n = 4 in each group). The lower bargraph in E is the quantification of western blot. *P < 0.05, **P < 0.01 vs. db/m mice (B, C) or control diet mice (D, E).

