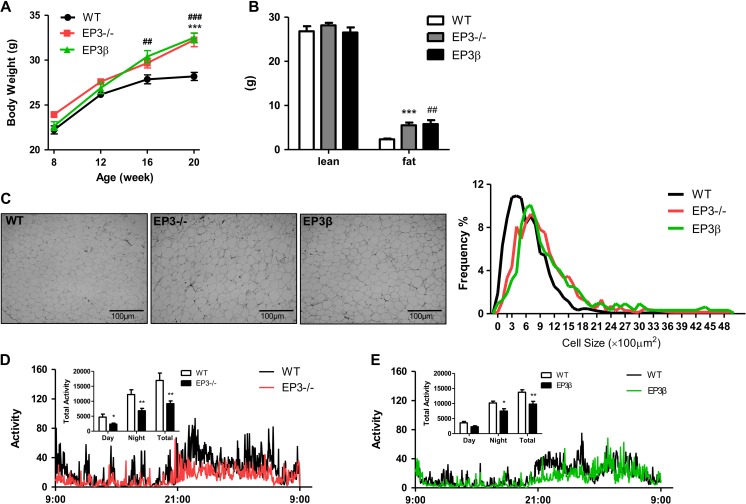
Figure 2.
Both EP3−/− and EP3β mice displayed spontaneous obese phenotype. (A) Increased body weight of the EP3− /− and EP3β mice. The body weight of male EP3− /− mice (n = 6), EP3β mice (n = 13), and their WT littermates (n = 34) were measured from 8 to 20 weeks. (B) MRI analysis of the body composition of WT, EP3−/−, and EP3β mice at 20 weeks. The lean mass and fat mass of WT (n = 6), EP3−/− (n = 7), and EP3β (n = 5) mice were analyzed. (C) Morphologic analysis of adipocytes from WAT of WT, EP3−/−, and EP3β mice at 20 weeks. Representative pictures (400×) are shown on the left. The adipocyte size and the frequency of the cell size were calculated and shown on the right. Three sections from different mice per group were randomly selected. (D and E) Less motor activities in the EP3−/− and EP3β mice than in WT mice. Motor activities were measured by the metabolic cage for 24 h lasting one light and dark cycle. Accumulated activities were calculated during light time, dark time, and total time course as shown in inset. n = 12 for WT, n = 12 for EP3−/− mice, and n = 9 for EP3β mice. The mice were measured at the age of 4−6 months. *P < 0.05, **P < 0.01, ***P < 0.001, EP3−/− vs. WT mice; #P < 0.05, ##P < 0.01, ###P < 0.001, EP3β vs. WT mice.

