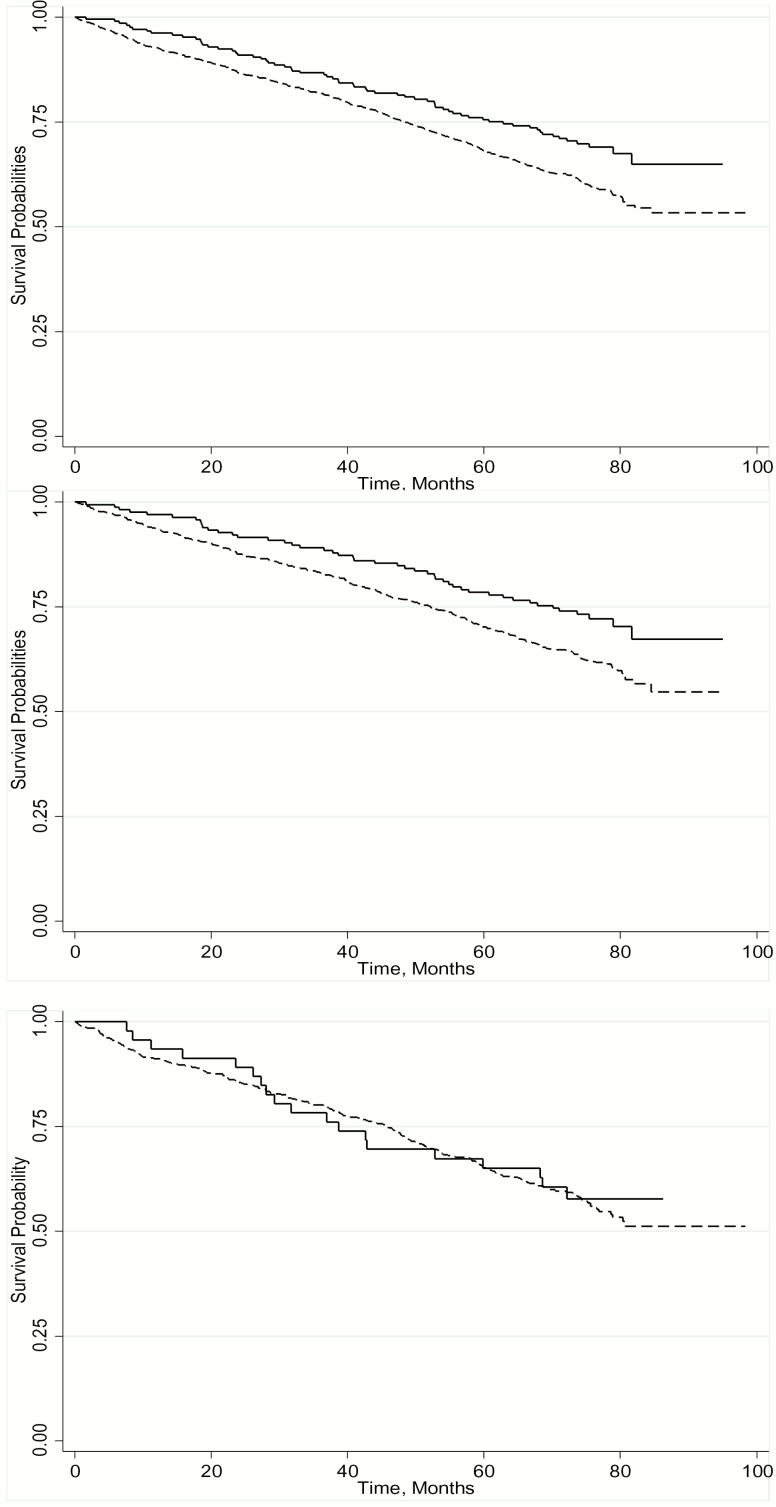
Figure 1.
Plots of Kaplan–Meyer survival estimates for all, women, and men by chamomile user status in the H-EPESE, 2000–2007. The top panel represents the entire sample (p = .008), the middle panel represents women (p = .011) and the bottom panel represents men (p = .824). In each panel, the dotted line represents no chamomile use, and the solid line represents chamomile use.

