
Fig. 1.
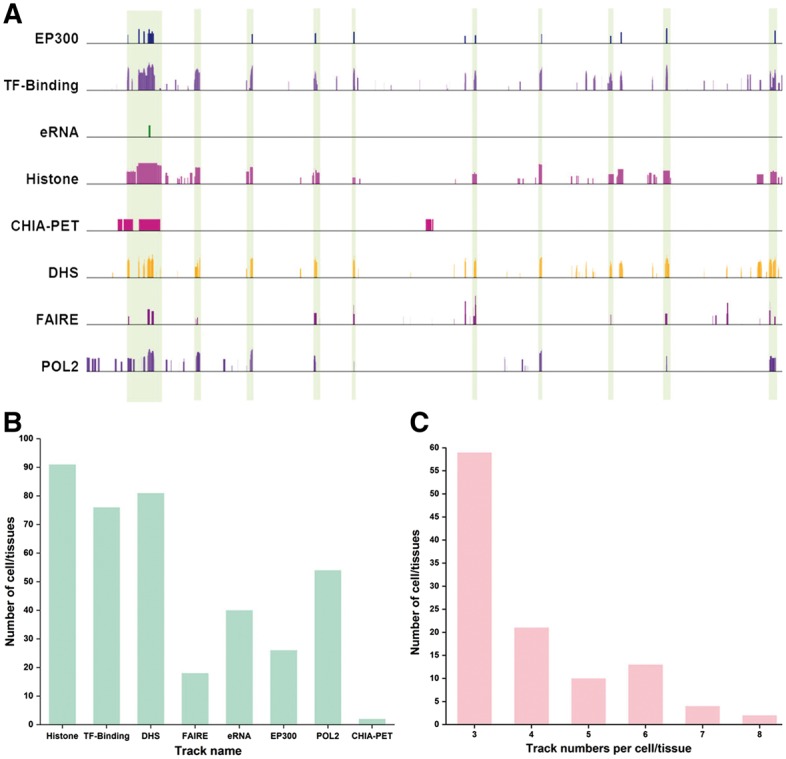
Enhancer annotation and datasets available for enhancer identification. (A) Consistence and discrepancies in enhancer annotation. In the region (chr1:27,515,285-27,848,296 in K562), the enhancers supported by many tracks are highlighted by vertical bars. It is clear that many potential regions are only supported by one or a few tracks. (B) Number of cell/types that contain a certain dataset types. Some technologies were more widely used than others for enhancer identification. (C) Number of cell/tissue types in function of number of independent tracks. Many cell/tissue types include a few tracks (e.g. 3 or 4), while a few cell/tissue types have many tracks (e.g. 7 or 8) (Color version of this figure is available at Bioinformatics online.)