Fig. 2.

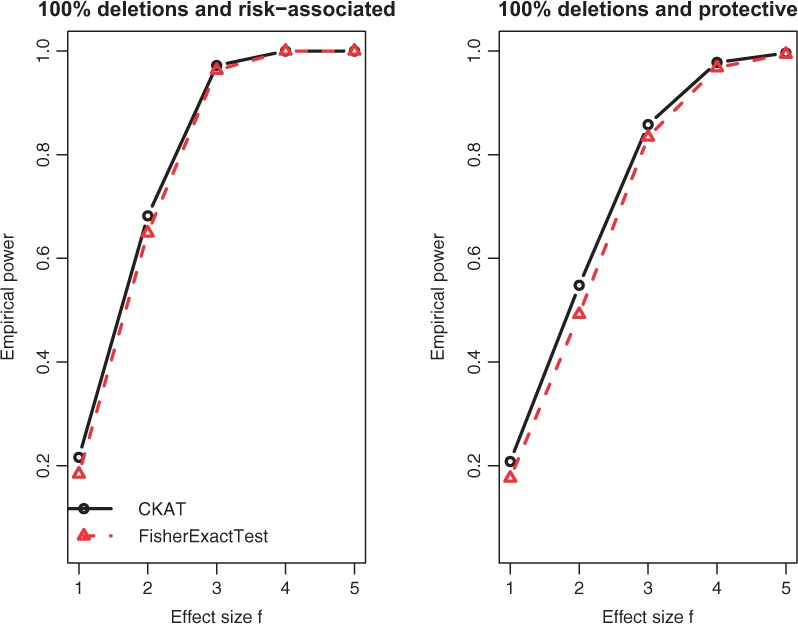
Empirical power of CKAT and Fisher’s exact test under Simulation I-A. The solid line is for CKAT and the dotted line is for Fisher’s exact test

Empirical power of CKAT and Fisher’s exact test under Simulation I-A. The solid line is for CKAT and the dotted line is for Fisher’s exact test