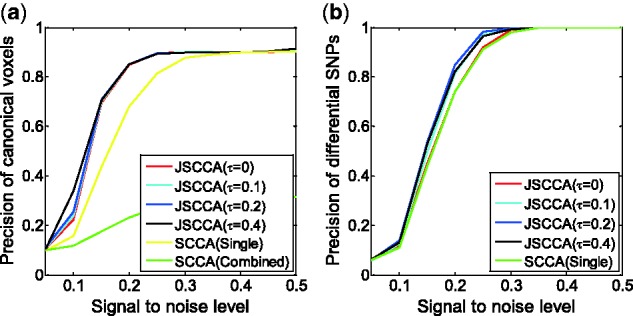
Fig. 3.

A comparison of the precision under different signal to noise levels. (a) precision for the detection of canonical voxels. (b) precision for the detection of differential canonical SNPs (Color version of this figure is available at Bioinformatics online.)
