Fig. 4.

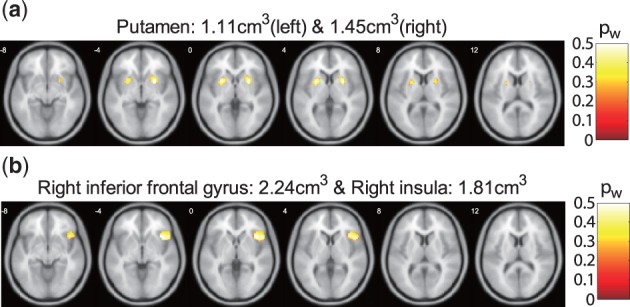
Maps showing the brain regions related to the SNPs. The magnitudes are the corresponding selection probability. (a) The first module, (b) the second module (Color version of this figure is available at Bioinformatics online.)

Maps showing the brain regions related to the SNPs. The magnitudes are the corresponding selection probability. (a) The first module, (b) the second module (Color version of this figure is available at Bioinformatics online.)