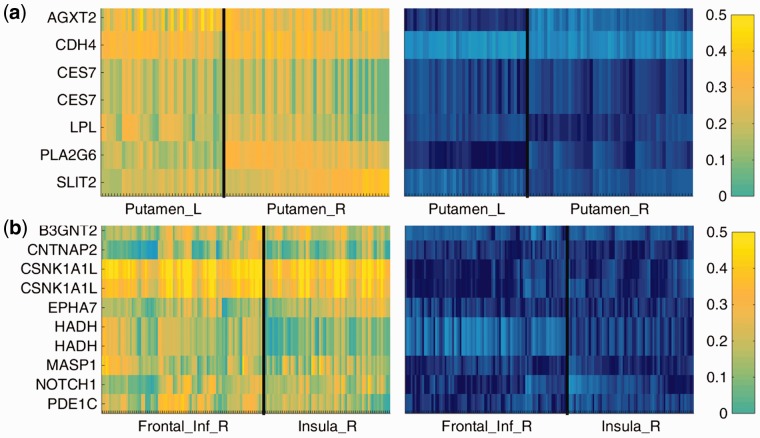
Fig. 5.
Heatmaps showing the pair-wise absolute Pearson correlation between the selected voxels and SNPs given the common colormap on the right, where the left is for cases while the right is for controls. (a) The first module, (b) the second module (Color version of this figure is available at Bioinformatics online.)

